> For the complete documentation index, see [llms.txt](https://docs.luciq.ai/llms.txt). Markdown versions of documentation pages are available by appending `.md` to page URLs; this page is available as [Markdown](https://docs.luciq.ai/product-guides-and-integrations/product-guides/application-performance-monitoring/instrumentation.md).
# Instrumentation
### Spans
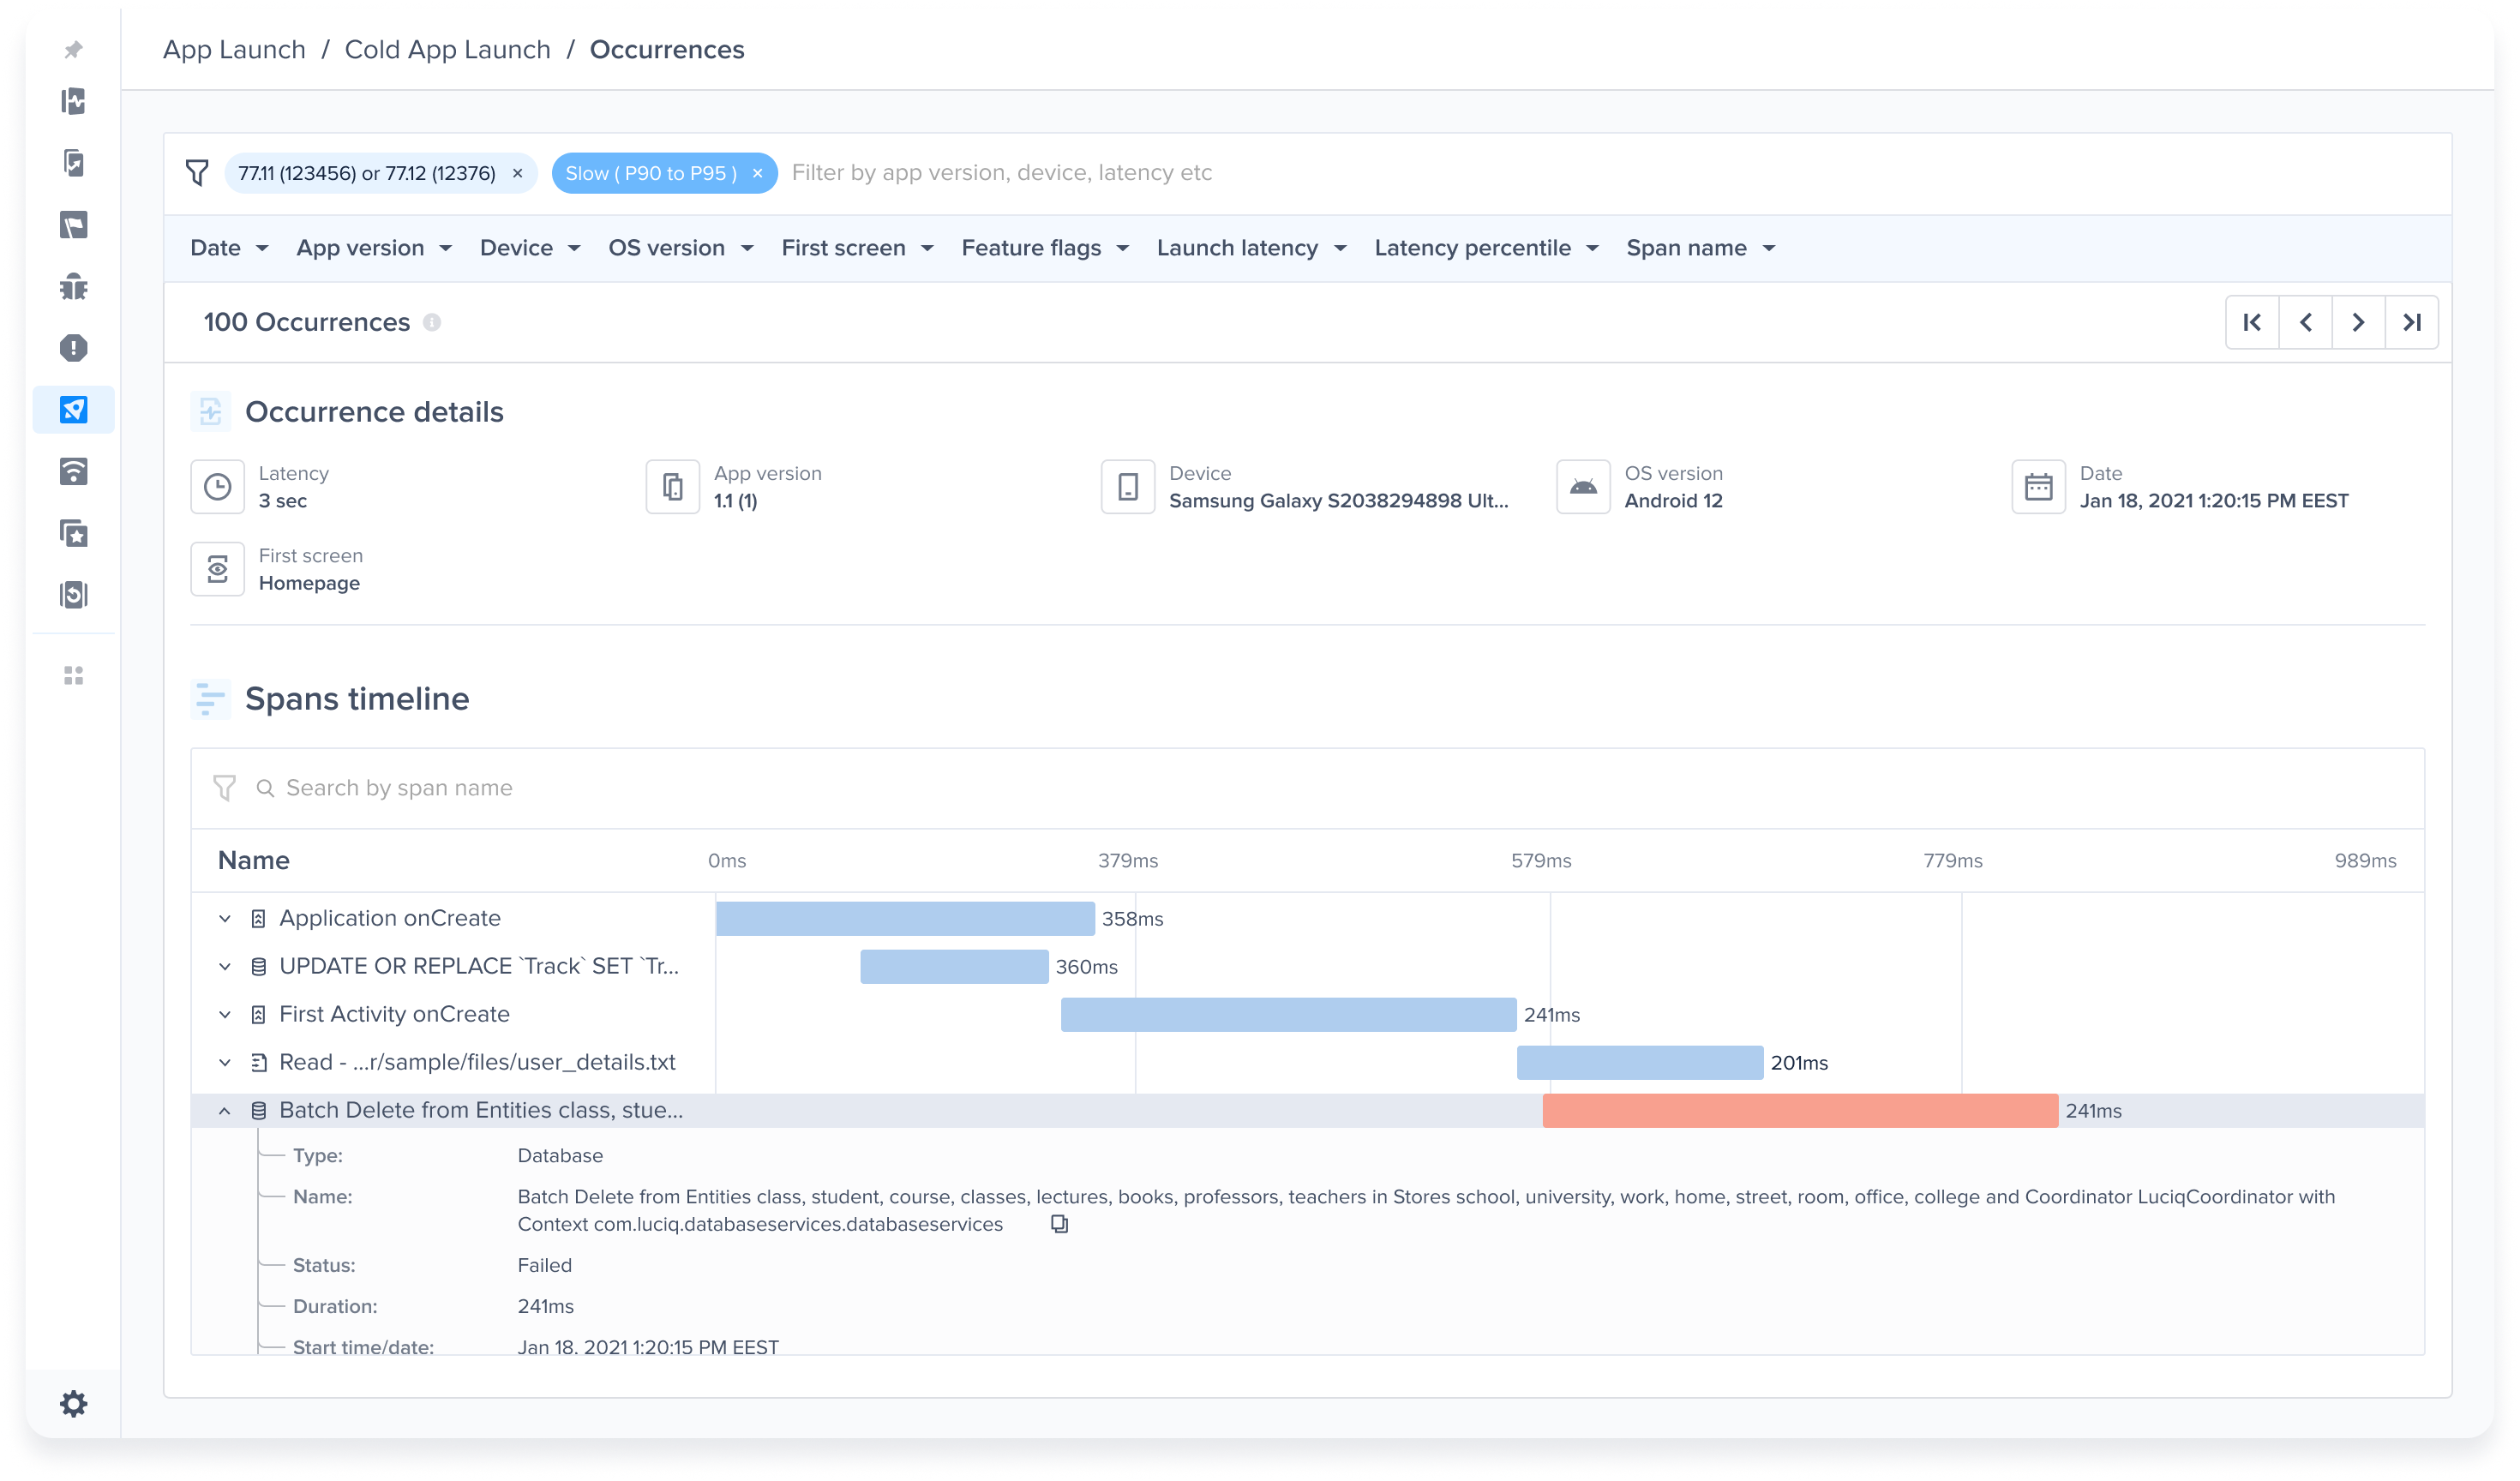
Spans allow you to better understand the root causes of the latencies that occur during your app’s launch and screen loading. This section provides a detailed breakdown of the duration of the platform life cycle stages, network calls, and more information during the app launch and screen loading.
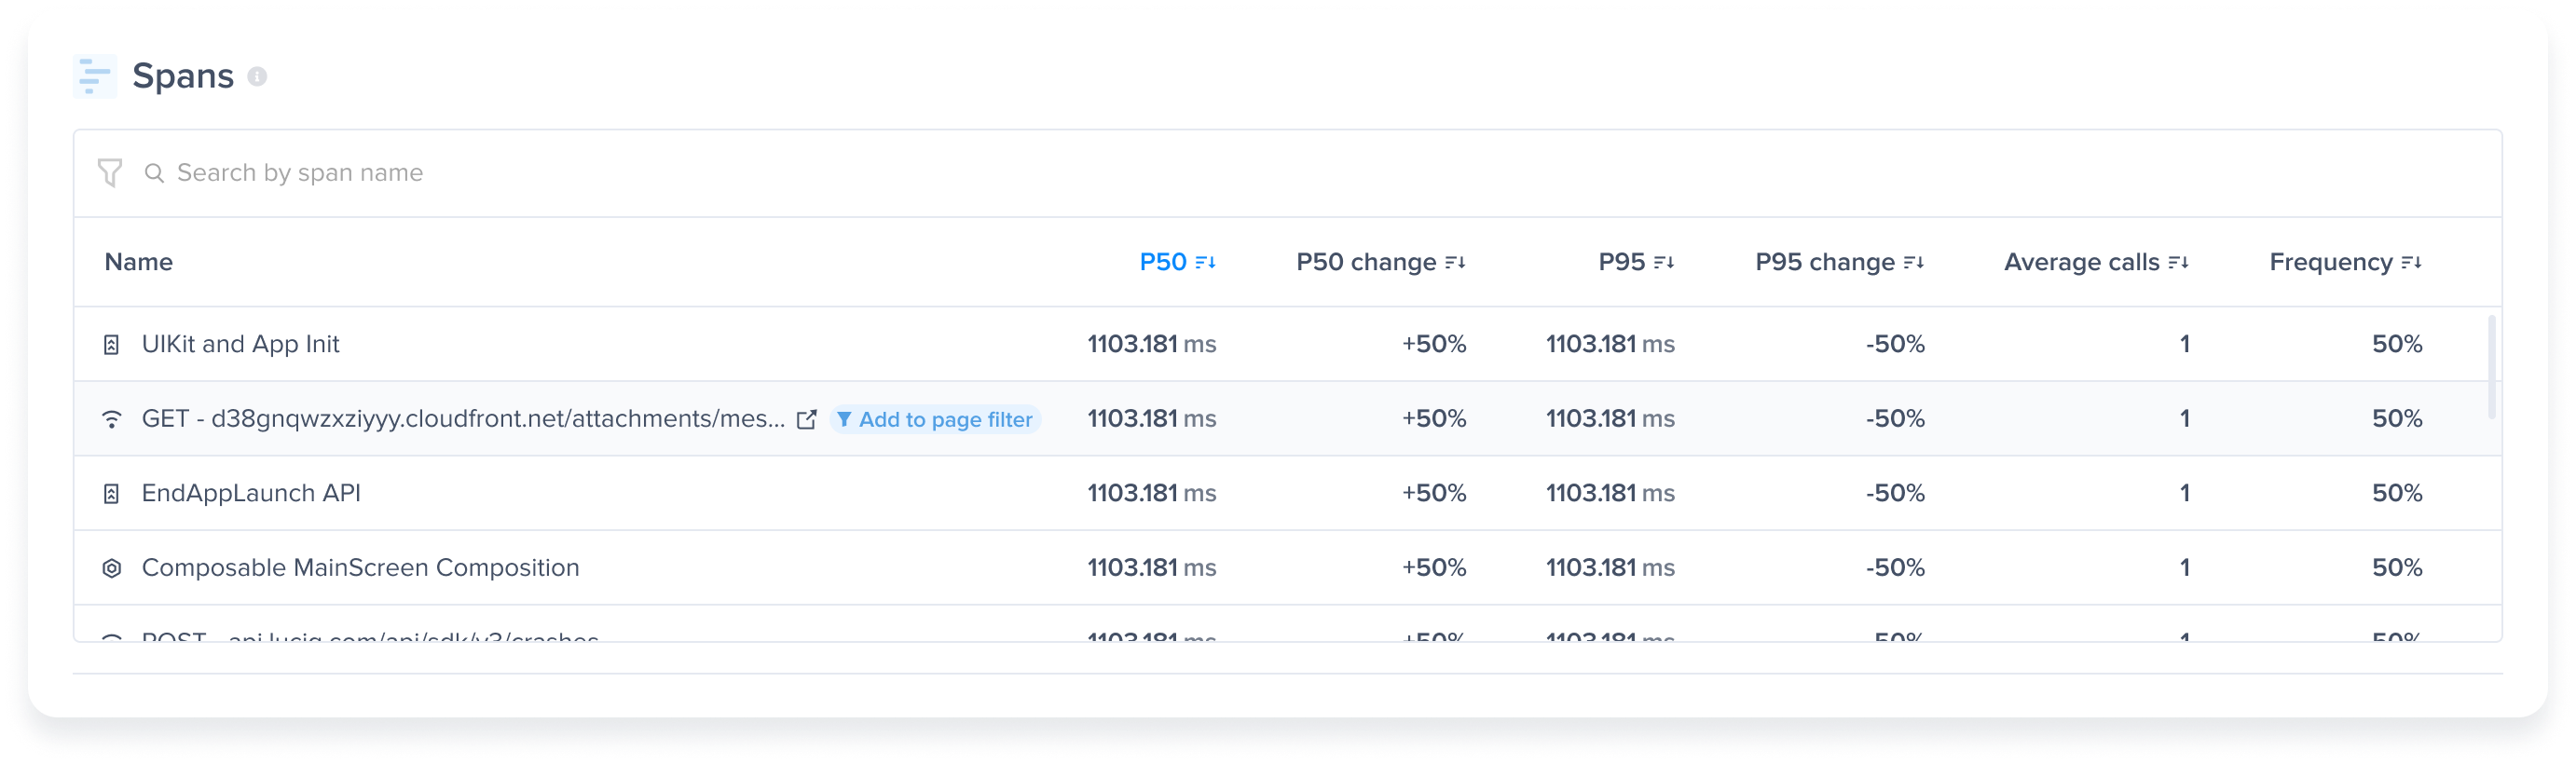
#### Spans Table Breakdown
| | |
| ---------------- | ------------------------------------------------------------------------------------------------------------------------------------------------------------------------------------------ |
| Span Name | This shows the stage or request name to identify its source. |
| P50 | This is the 50th percentile, which is the maximum latency that 50% of all the occurrences have in the selected time period and is shown in ms. |
| P95 | This is the 95th percentile, which is the maximum latency that 95% of all the occurrences have in the selected time period and is shown in ms. |
| P50 & P95 Change | This shows the change rate of P50 & P95 durations in comparison to the last period based on the selected date filter. |
| Average Calls | This shows how many times the span happened per single occurrence to understand its redundancy better. To get the overall duration of this span, multiply the Average Call by the P50/P95. |
| Frequency | This is how many times the span happened per all occurrences of the specified metric. |
#### Supported Span Types
These are the currently supported Span Types:
* View Loading.
* Network.
* App Initialization.
* Database Queries.
#### Database Queries
You'll be able to see the Database queries that happen during your app launch or screen loading with all its details in the spans table and occurrences view.
### Spans Table in Network Metric
To help you have a better understanding of what's causing the bulk delays inside your network calls, either from the Client, Server, or Network sides, you'll be able to see a detailed breakdown of the latencies caused by the stages/operations that were made to send the network request and receive its response from the server on aggregation and occurrence levels inside the network metric.
You can read more about the Spans table in Network Metric [here](https://docs.luciq.ai/product-guides-and-integrations/product-guides/application-performance-monitoring/instrumentation).
{% hint style="info" %}
If you are using the `EndAppLaunch` or `EndScreenLoading` APIs, Luciq captures the duration from the start of the app launch or screen loading up until the call of any of the APIs.
{% endhint %}
---
# Agent Instructions
This documentation is published with GitBook. GitBook is the documentation platform designed so that both humans and AI agents can read, navigate, and reason over technical content effectively. Learn more at gitbook.com.
## Querying This Documentation
If you need additional information that is not directly available in this page, you can query the documentation dynamically by asking a question.
Perform an HTTP GET request on the current page URL with the `ask` query parameter, and the optional `goal` query parameter:
```
GET https://docs.luciq.ai/product-guides-and-integrations/product-guides/application-performance-monitoring/instrumentation.md?ask=&goal=
```
`ask` is the immediate question: it should be specific, self-contained, and written in natural language.
`goal` is optional and describes the broader end goal you are ultimately trying to accomplish on behalf of the user. GitBook uses it to tailor the answer towards what is most useful for that goal.
The response will contain a direct answer to the question and relevant excerpts and sources from the documentation.
Use this mechanism when the answer is not explicitly present in the current page, you need clarification or additional context, or you want to retrieve related documentation sections.