> For the complete documentation index, see [llms.txt](https://docs.luciq.ai/llms.txt). Markdown versions of documentation pages are available by appending `.md` to page URLs; this page is available as [Markdown](https://docs.luciq.ai/product-guides-and-integrations/product-guides/team-dashboard.md).
# Team Dashboard
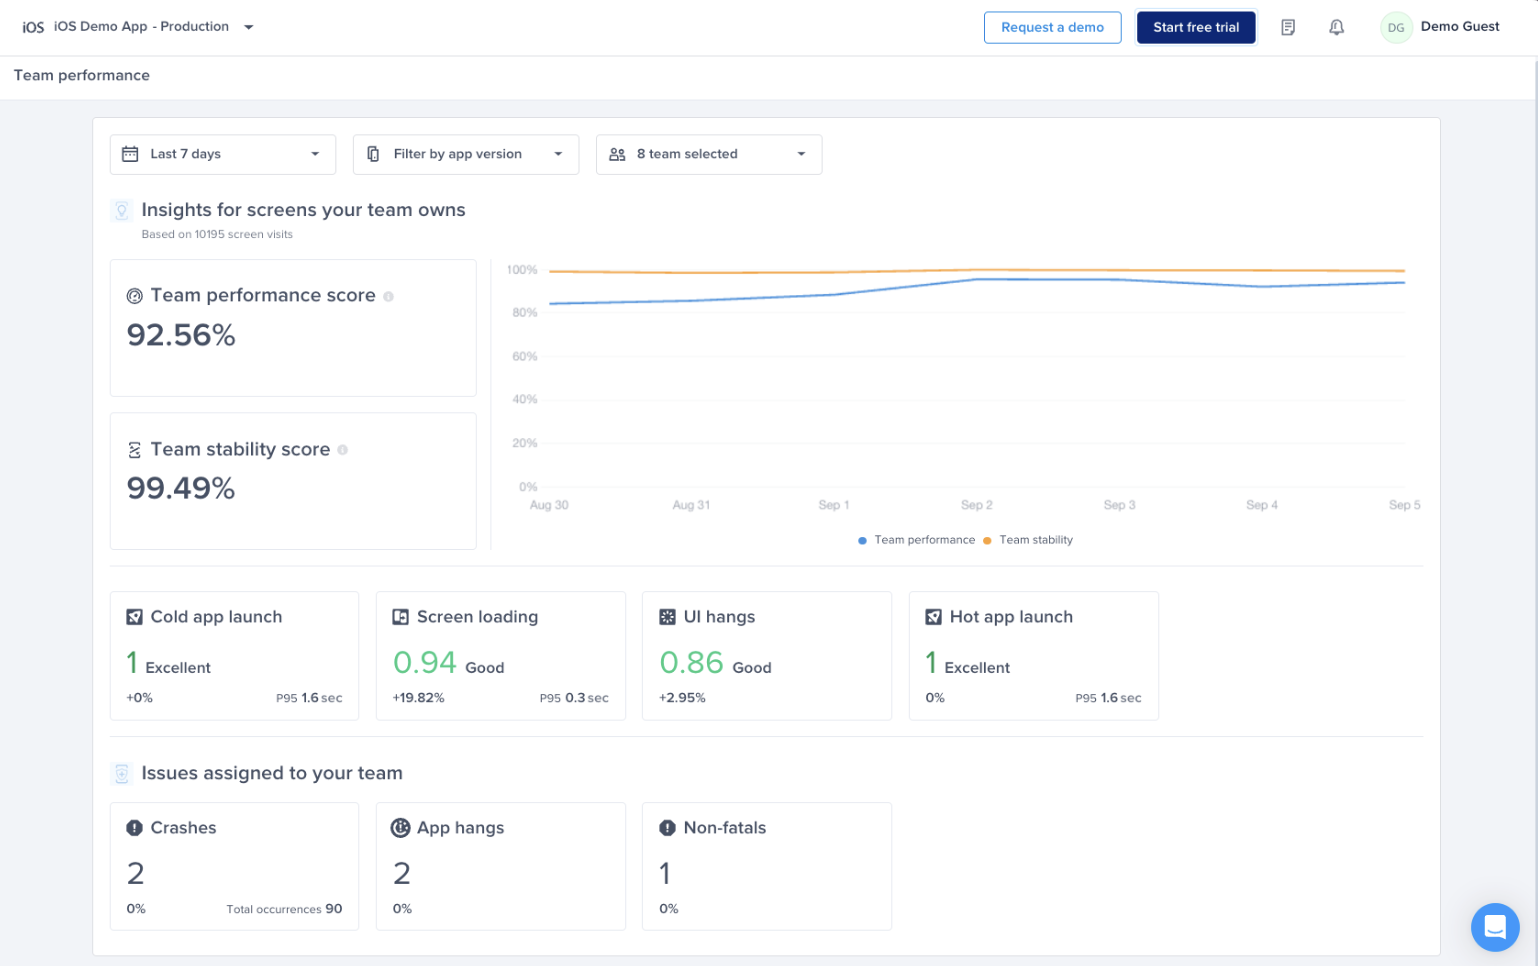
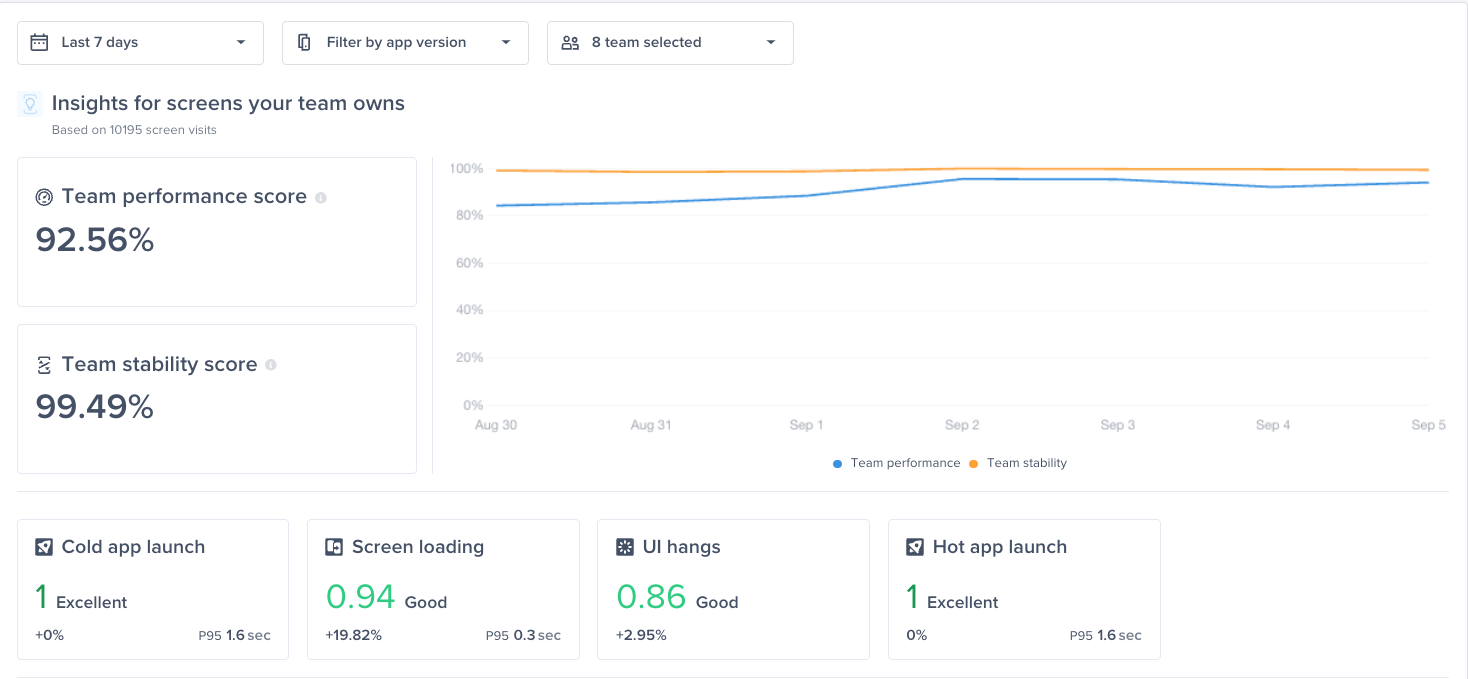
The Team Dashboard page helps track and improve your team’s ownership of screens by monitoring performance and stability metrics like app launch time, loading speed, UI hangs, and crashes. It allows leaders to identify and address issues affecting their team's areas, ensuring alignment with overall app performance goals.
You can find the page under the “App Overview” section in the Navbar
### Metrics Supported
#### **Performance Metrics Supported:**
* Cold app launch
* Hot app launch
* Screen loading
* UI hangs
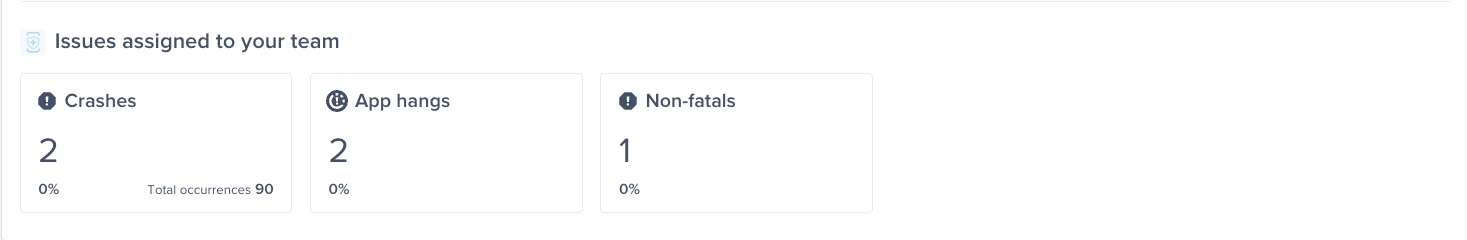
#### **Issues you can assign to your team:**
* Fatal crashes
* App hangs
* Non-fatal crashes
#### **Team Dashboard Score Calculation**
Here’s the breakdown of the weighted average we use across the performance metrics supported to come up with your team’s dashboard score:
* Cold app launches weight: 24%
* Screen loading weight: 36%
* UI hangs weight: 40%
#### **Team Stability Score Calculation**
Here’s how we calculate your team's overall stability:
* Team stability = Number of screen visits of the screens assigned to your team that didn't end in a crash / Total number of screen visits of the screens assigned to your team.
### Setup Guide
To start using the Team Dashboard page, you need to follow these simple steps:
#### **Step 1: Create A Team**
If you don’t already have teams defined on your Luciq dashboard, you can do so by:
1. Click on your name at the top right corner
2. Choose Account Management
3. Choose teams
4. Click on Create your first team
5. Name your team and assign team members to it
#### **Step 2: Define Performance Metrics Ownership**
In order to see your team’s dashboard score, stability score, cold app launch apdex, screen loading apdex and UI hangs apdex, you need to define ownership for performance metrics.
1. Go to the settings page at the bottom left of the navbar
2. Choose Team Ownership
3. Click Define ownership
4. Choose Type “Performance metrics”
5. Choose the team you’d like to assign screens to
6. Choose condition Screens
7. For Screen name, you can search and select all screens you’d like to assign to that team
#### **Step 3: Define Crash Ownership**
In order to automatically assign fatal crashes, app hangs and non fatal crashes to your team, you need to define the ownership of crashes
1. Go to the settings page at the bottom left of the navbar
2. Choose Team Ownership
3. Click Define ownership
4. Choose Type “Crashes”
5. Define the path, package, or file you’d like to assign crashes happening on to your team
6. You can also assign a specific crash to a team from the specific crash’s page
---
# Agent Instructions
This documentation is published with GitBook. GitBook is the documentation platform designed so that both humans and AI agents can read, navigate, and reason over technical content effectively. Learn more at gitbook.com.
## Querying This Documentation
If you need additional information that is not directly available in this page, you can query the documentation dynamically by asking a question.
Perform an HTTP GET request on the current page URL with the `ask` query parameter, and the optional `goal` query parameter:
```
GET https://docs.luciq.ai/product-guides-and-integrations/product-guides/team-dashboard.md?ask=&goal=
```
`ask` is the immediate question: it should be specific, self-contained, and written in natural language.
`goal` is optional and describes the broader end goal you are ultimately trying to accomplish on behalf of the user. GitBook uses it to tailor the answer towards what is most useful for that goal.
The response will contain a direct answer to the question and relevant excerpts and sources from the documentation.
Use this mechanism when the answer is not explicitly present in the current page, you need clarification or additional context, or you want to retrieve related documentation sections.