

Network
Payload Size
By default, Luciq captures the payload size of the request and response; this should help with determining if the payload size could be causing any issues with network delays. The payload size is the size of the payload itself, so it does not include the header's size.
Luciq automatically buckets payload sizes into different buckets based on the distribution of the data per network group, with a minimum sensitivity of 10 bytes per bucket.
URL Patterns
URL patterns are used to group the relevant network call occurrences and aggregate their numbers. Let's take the following examples:
sample.com/list/3/item/1sample.com/list/3/item/2sample.com/profile/
It looks like 1 and 2 are the same request, but asking for different resources. While 3 is an entirely different one. Those three examples result in the following 2 URL patterns:
sample.com/list/*/item/*sample.com/profile/
What Are the URL Pattern Components?
Plain text: works with exact string matching.
*: matches with any URL part.*matches with only one part at a time. For example, if you are mappingsample.com/part/variable1/variable2, your pattern should besample.com/part/*/*and notsample.com/part/*
Does Luciq Detect Patterns Automatically?
Luciq automatically detects numbers and hexadecimal tokens in your URLs and replaces them with *.
Can You Create Custom Patterns?
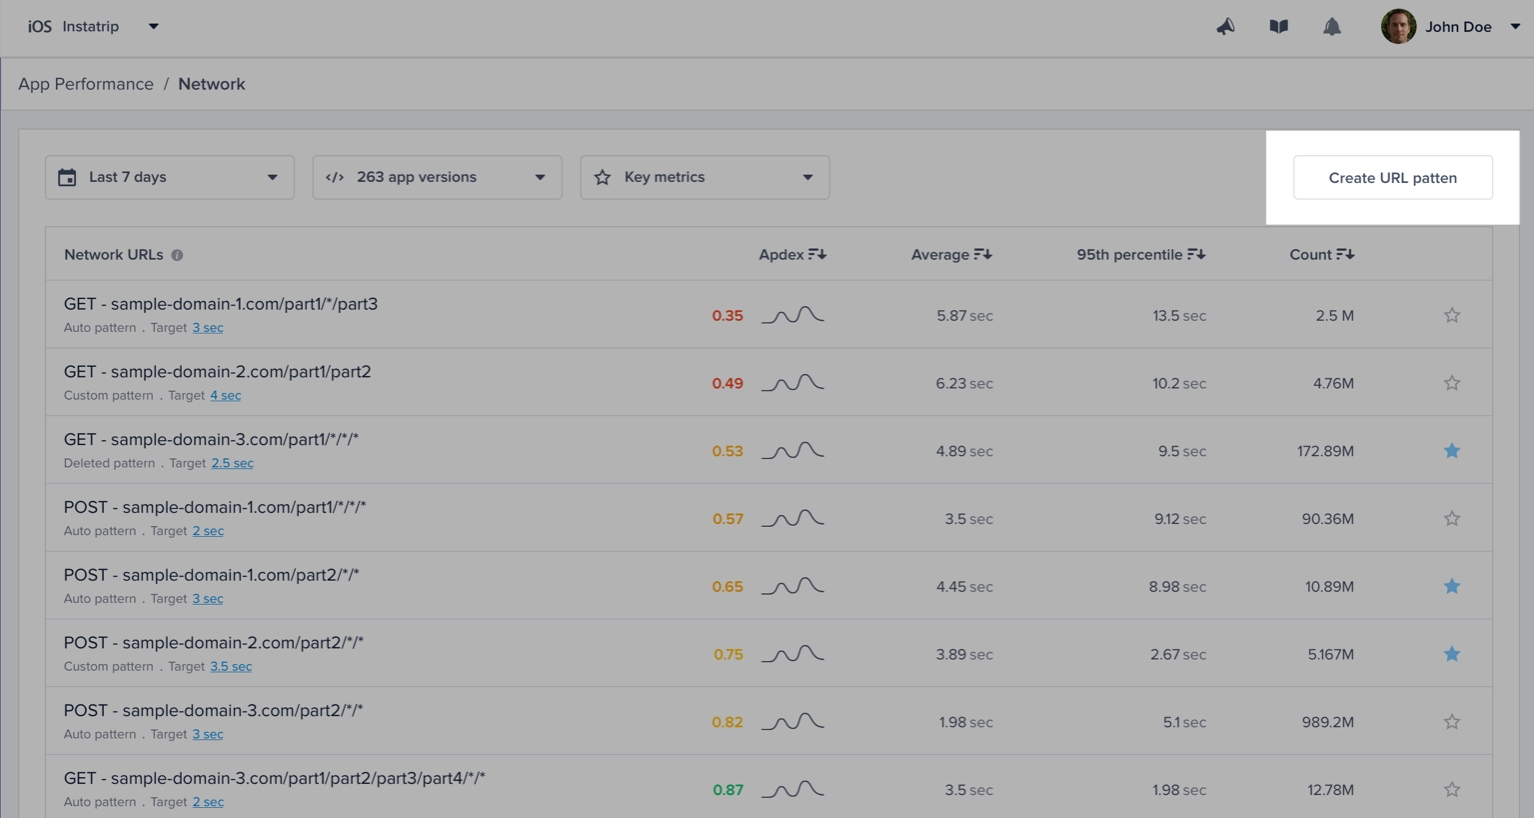
If you are using more complex URLs where variable parts may contain plain text and not only numbers and hexadecimal, we recommend defining your custom patterns. Just click on the "Create URL pattern" button in your network list.
Here are a few examples:
URL pattern example
Matches with
Doesn't match with
sample.com/part1/part2
sample.com/part1/part2
sample.com/part1
sample.com/part1/*
sample.com/part1/part2
sample.com/part1/part2/part3
sample.com/part1/*/part3
sample.com/part1/part2/part3
sample.com/part1/part3/part4
sample.com/part1/part2/part3/part4
sample.com/part1/*/*/part4
sample.com/part1/part2/part3/part4
sample.com/part1/part2/part4
sample.com/part1/part2/part3/part4/part5
sample.com/part1/*/*/*
sample.com/part1/part2/part3/part4
sample.com/part1/part2/part3/part4/part5
sample.com/part1/part2/part3
Some notes to consider while creating your URL patterns:
Custom URL patterns that you define have higher precedence than the auto-generated ones. If the same call matches with a custom and an auto pattern, it gets grouped with the custom.
At any point, you can delete a pattern to prevent grouping new calls with it.
URL patterns shouldn't overlap. Each incoming network call gets grouped with only one pattern. In case of conflict, it gets merged with the newest pattern.
Network Calls Apdex
Luciq calculates an Apdex score for every network request (URL pattern) in your app. Apdex score ranges between 0 and 1. The higher the value, the closer you are to satisfying a user experience:
Apdex score ≥ 0.94 equates to Excellent performance.
Apdex score ≥ 0.85 and < 0.94 equates to Good performance.
Apdex score ≥ 0.7 and < 0.85 equates to Fair performance.
Apdex score ≥ 0.5 and < 0.7 equates to Poor performance.
Apdex score < 0.5 is considered Unacceptable.
How Is the Network Calls Apdex Calculated?
When a network call occurrence is collected, it is flagged based on a pre-defined target (T). A network call occurrence is considered:
Satisfying: if its duration ≤ T
Tolerable: if its duration > T and ≤ 4T
Frustrating: if its duration > 4T or if it fails due to a server-side or client-side error.
Then, based on the bucketing explained above, the Apdex is calculated:
Total occurrences = Satisfying occurrences + Tolerable occurrences + Frustrating occurrencesApdex score = (Satisfying occurrences + 0.5 * Tolerable occurrences) / Total occurrences
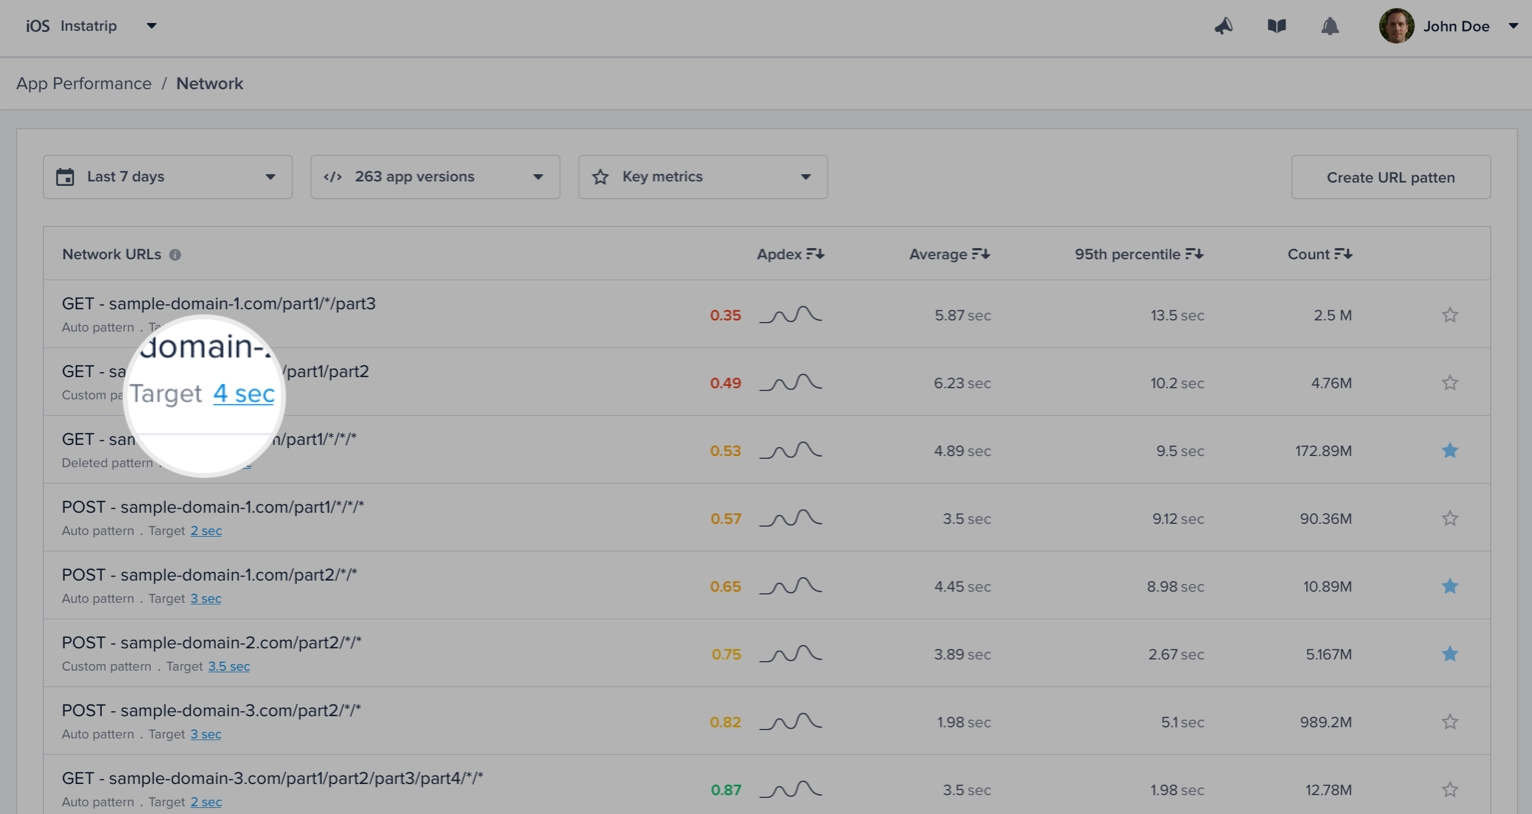
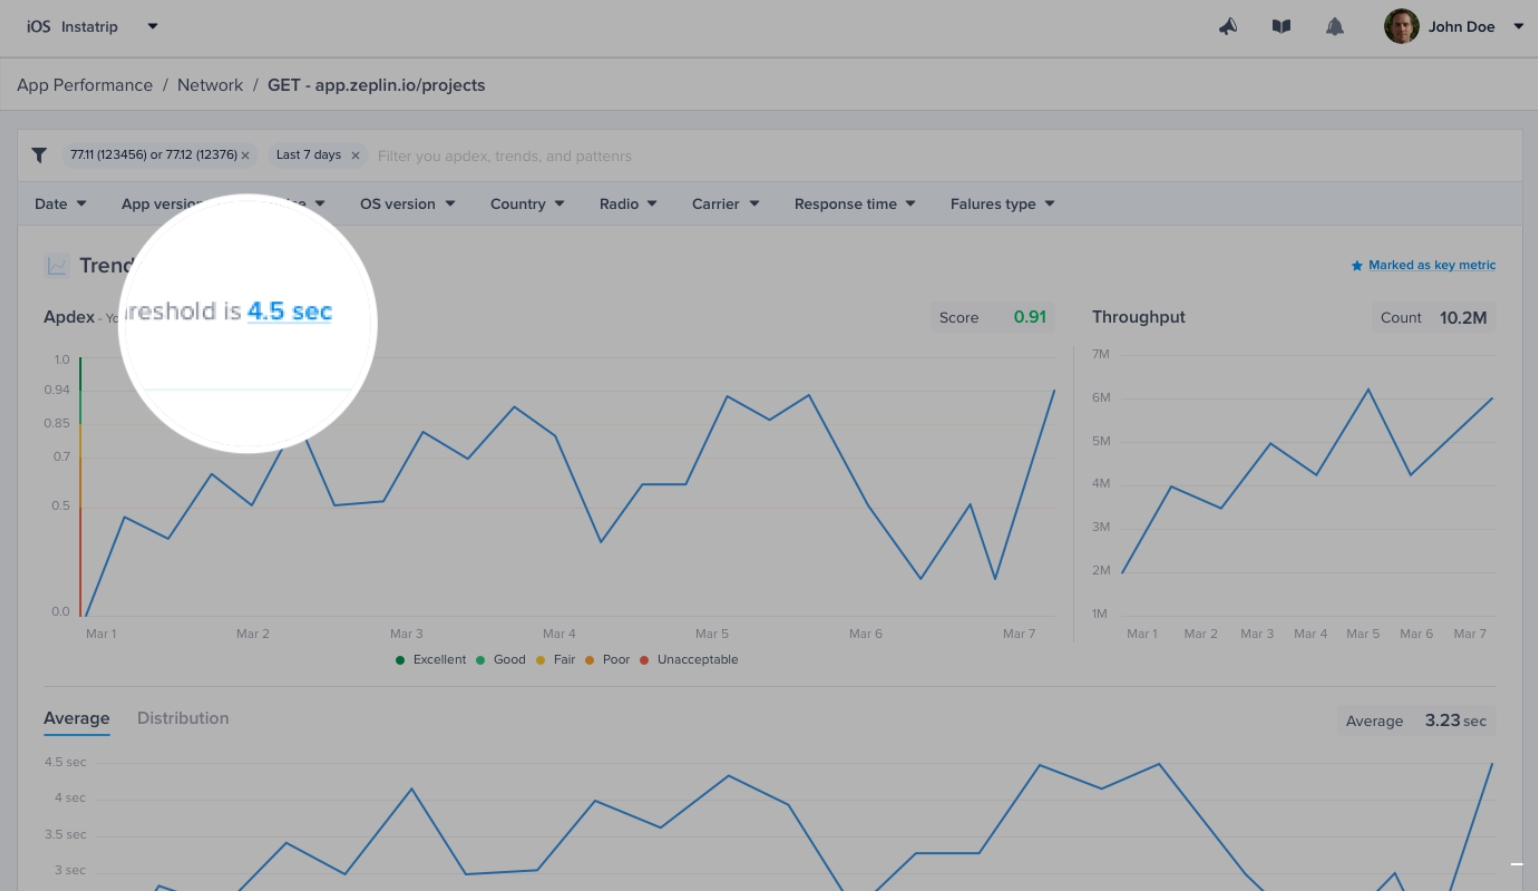
How Can You Control a Specific Network Call's Target?
By default, it is set to 0.5 seconds; however, you can easily change this number from your dashboard by clicking on the action highlighted in the screenshots below.
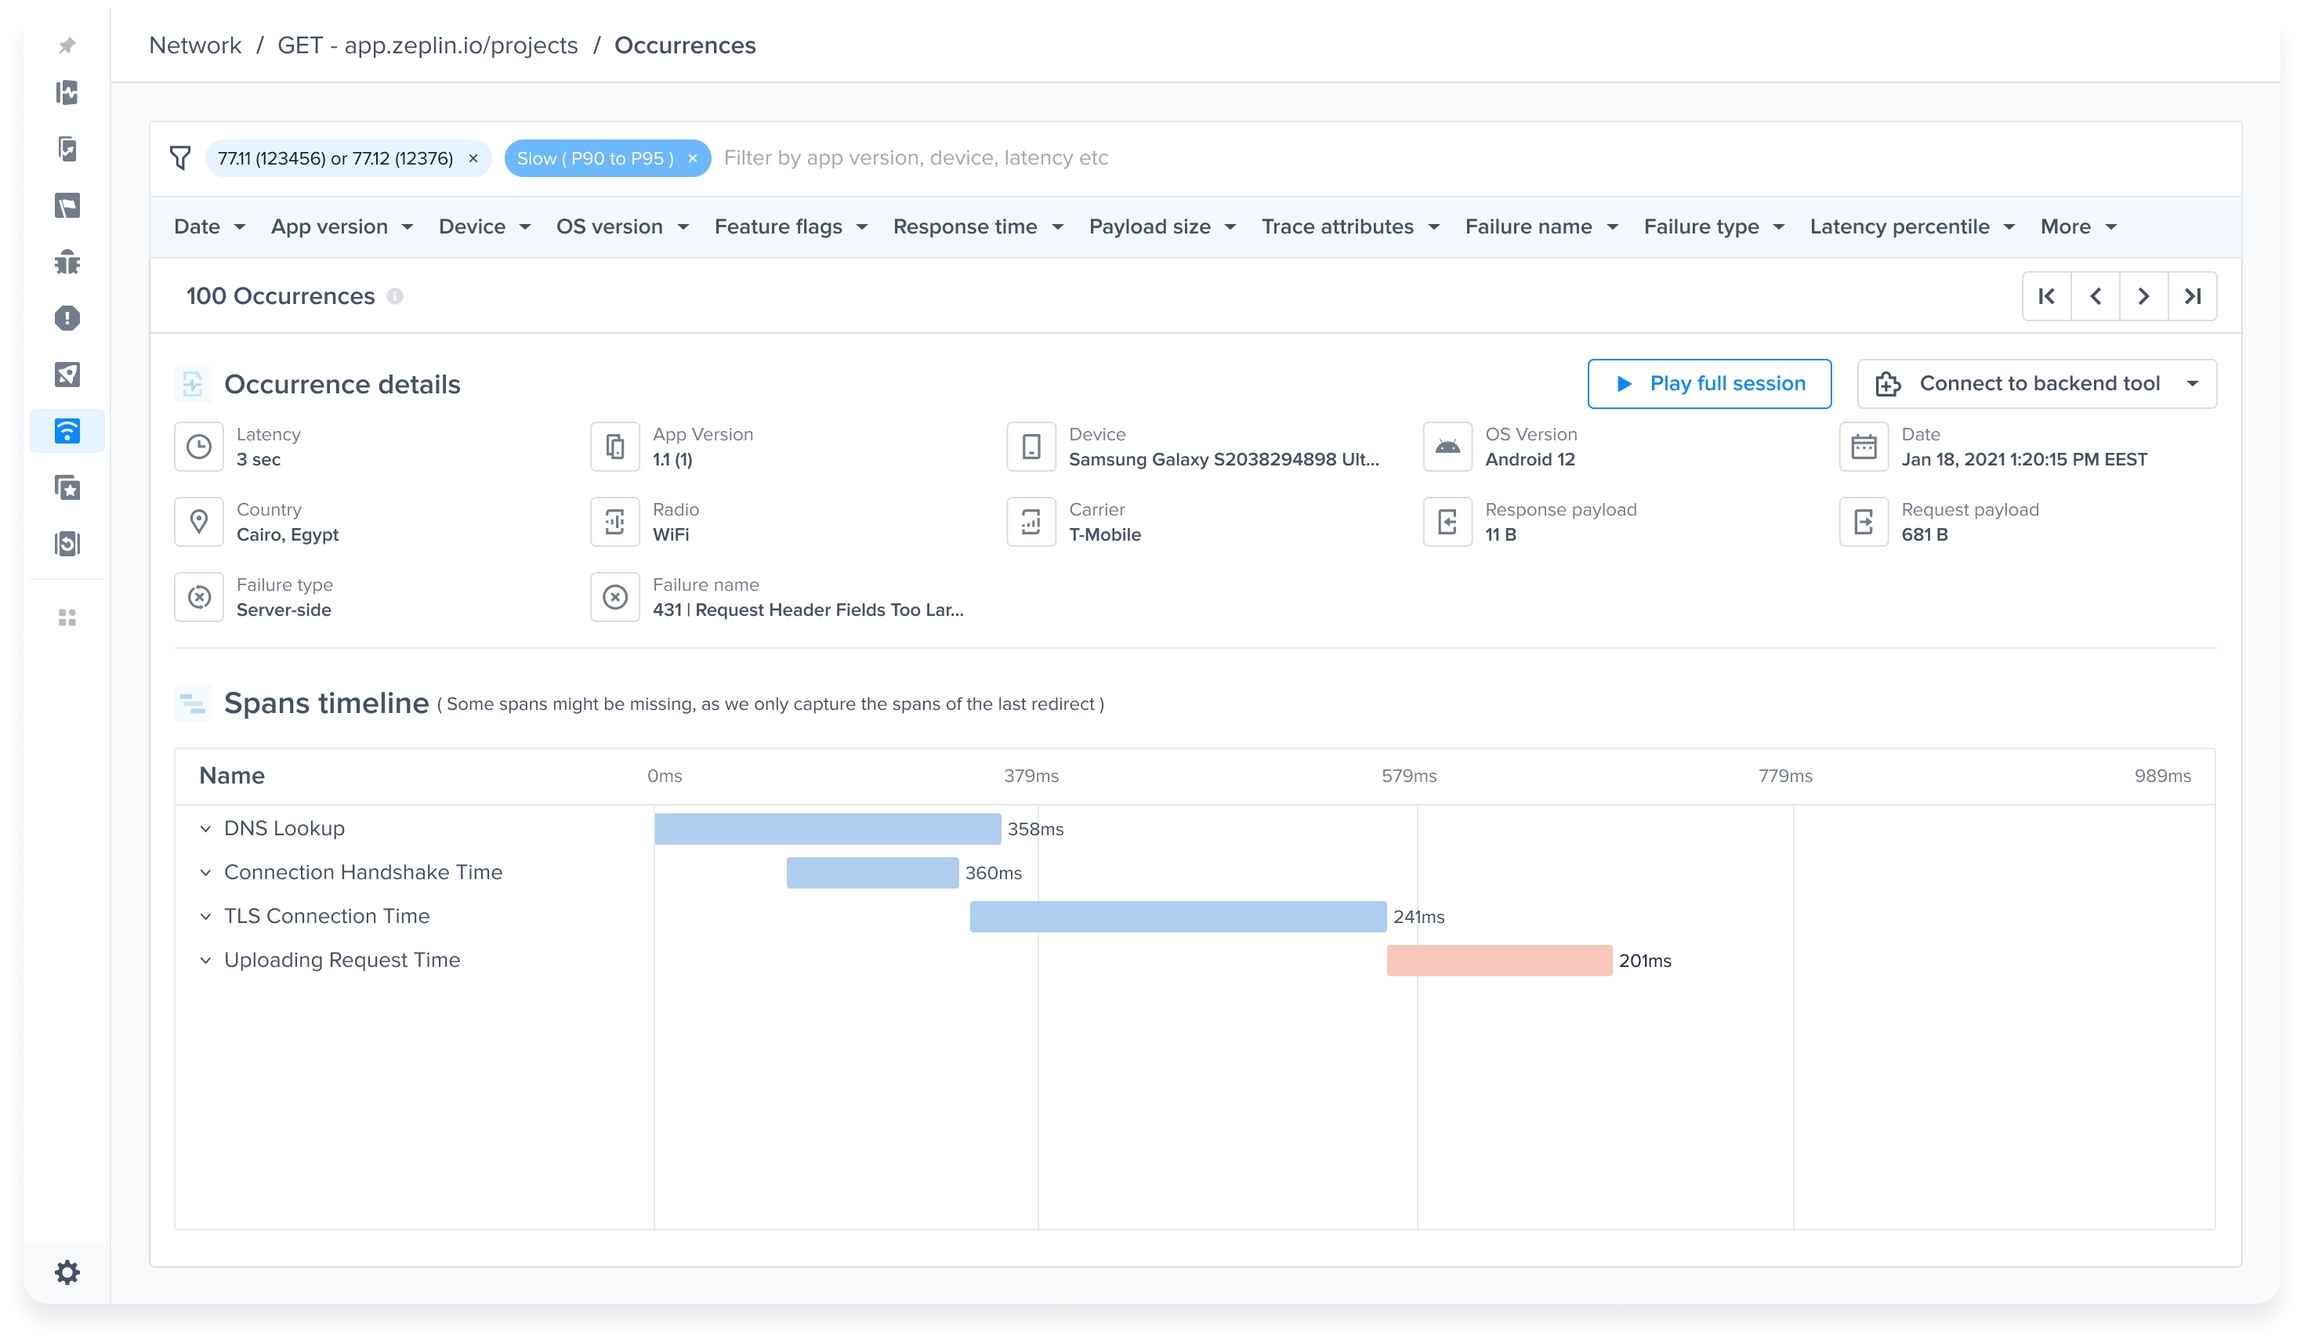
Network Latency Breakdown
You can see the P50s, P95s, and the frequency of each stage/operation that occurred inside a network group. These are the stages/operations that were made to send the network request and receive its response from the server.
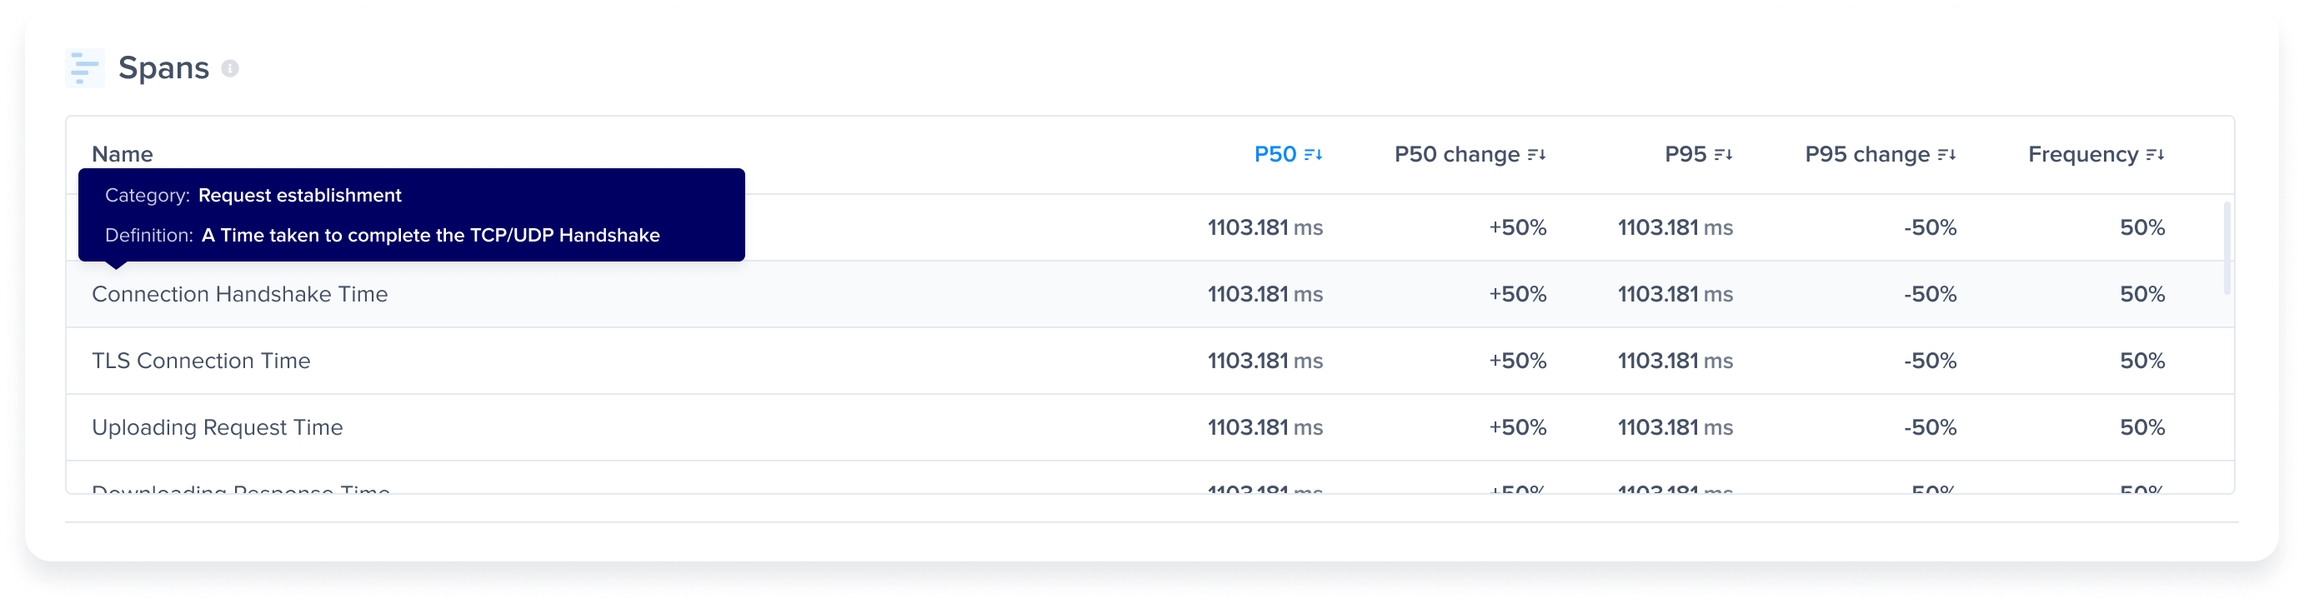
The feature works out of the box without any instrumentation, and the stages are shown inside the Spans table inside the Network metric.
The spans table contains the following stages:
DNS Lookup
Connection Handshake
TLS Connection
Uploading Request
Downloading Response
Server Processing
You can also see the breakdown and visualize the stages' timeline on an occurrence level inside the occurrences page.
Last updated