

Crash Reporting Types
Privacy Policy
It is highly recommended to mention in your privacy policy that you may be collecting logging data in order to assist with troubleshooting crashes.
Crash Types
Fatal Crash: Fatal crashes refer to an error or issue that causes the app to terminate unexpectedly, meaning the app completely shuts down and is no longer usable until the user restarts it. These crashes interrupt the user experience, as the app cannot recover from the issue on its own and must be relaunched. Fatal crashes are the most severe type of crashes, and they generate crash reports that help developers investigate what caused the app to crash. Typically, they occur due to unhandled errors, system conflicts, or serious resource issues. Here are the types of fatal crashes
Non-Fatals: Non-fatal crashes refer to an error or issue that occurs in the app but doesn’t cause the app to completely shut down or crash. Instead, the app encounters a problem, such as an exception or unexpected behavior, but is able to continue running without quitting. Non-fatal crashes are useful for developers because they provide insights into bugs or problems that need fixing before they turn into full-blown crashes.
iOS Specific Issues
Signal-based crashes: These are crashes triggered by low-level system signals, typically due to issues like segmentation faults or accessing invalid memory. Common signals include SIGSEGV, SIGBUS, and SIGABRT.
Exception-based crashes: These occur when an unhandled exception (such as NSException) is thrown, causing the app to crash. This can result from incorrect logic in the app or unhandled edge cases.
Objective-C runtime errors: Crashes that occur due to issues with the Objective-C runtime, such as unrecognized selectors (when a message is sent to a nil object or invalid object). These crashes happen when the app is trying to follow instructions, but one is missing or wrong.
OOM: Out-of-memory crashes occur when the app uses more memory than the device can provide, causing the system to terminate the app to free up resources. Common causes of OOM crashes include: Memory leaks, Heavy resource usage, and Retaining too many objects.
Android Specific Issues
Native crashes: Caused by issues in the native layer of an app, often written in C or C++ (e.g., NDK crashes). These involve signals like SIGSEGV, SIGBUS, or SIGABRT, similar to iOS.
Java exceptions: Unhandled exceptions in the Java layer, such as NullPointerException, ArrayIndexOutOfBoundsException, or IllegalArgumentException, that cause the app to crash.
ANR (Application Not Responding): When the main thread is blocked for too long, leading to an ANR error. This is an Android-specific type where the system prompts the user to either wait or force close the app.
React Native specific Issues
JavaScript exceptions: Crashes caused by unhandled exceptions in JavaScript, the main programming language for React Native apps. These include syntax errors, type errors, or issues like undefined is not an object.
Flutter Specific Issues
Dart exceptions: Crashes caused by unhandled exceptions in Dart code, which is the primary language used for Flutter development. Examples include NoSuchMethodError, StateError, or FormatException.
With Luciq Crash Reporting there are two ways to have your application report a crash; either automatically or manually. After the crash is sent to your dashboard, you can easily sort and filter for specific crashes.
Reporting Crashes
Automatic Crash Reporting
If you enable Crash Reporting, crashes will automatically be reported to and viewable from the crashes page of your Luciq dashboard.
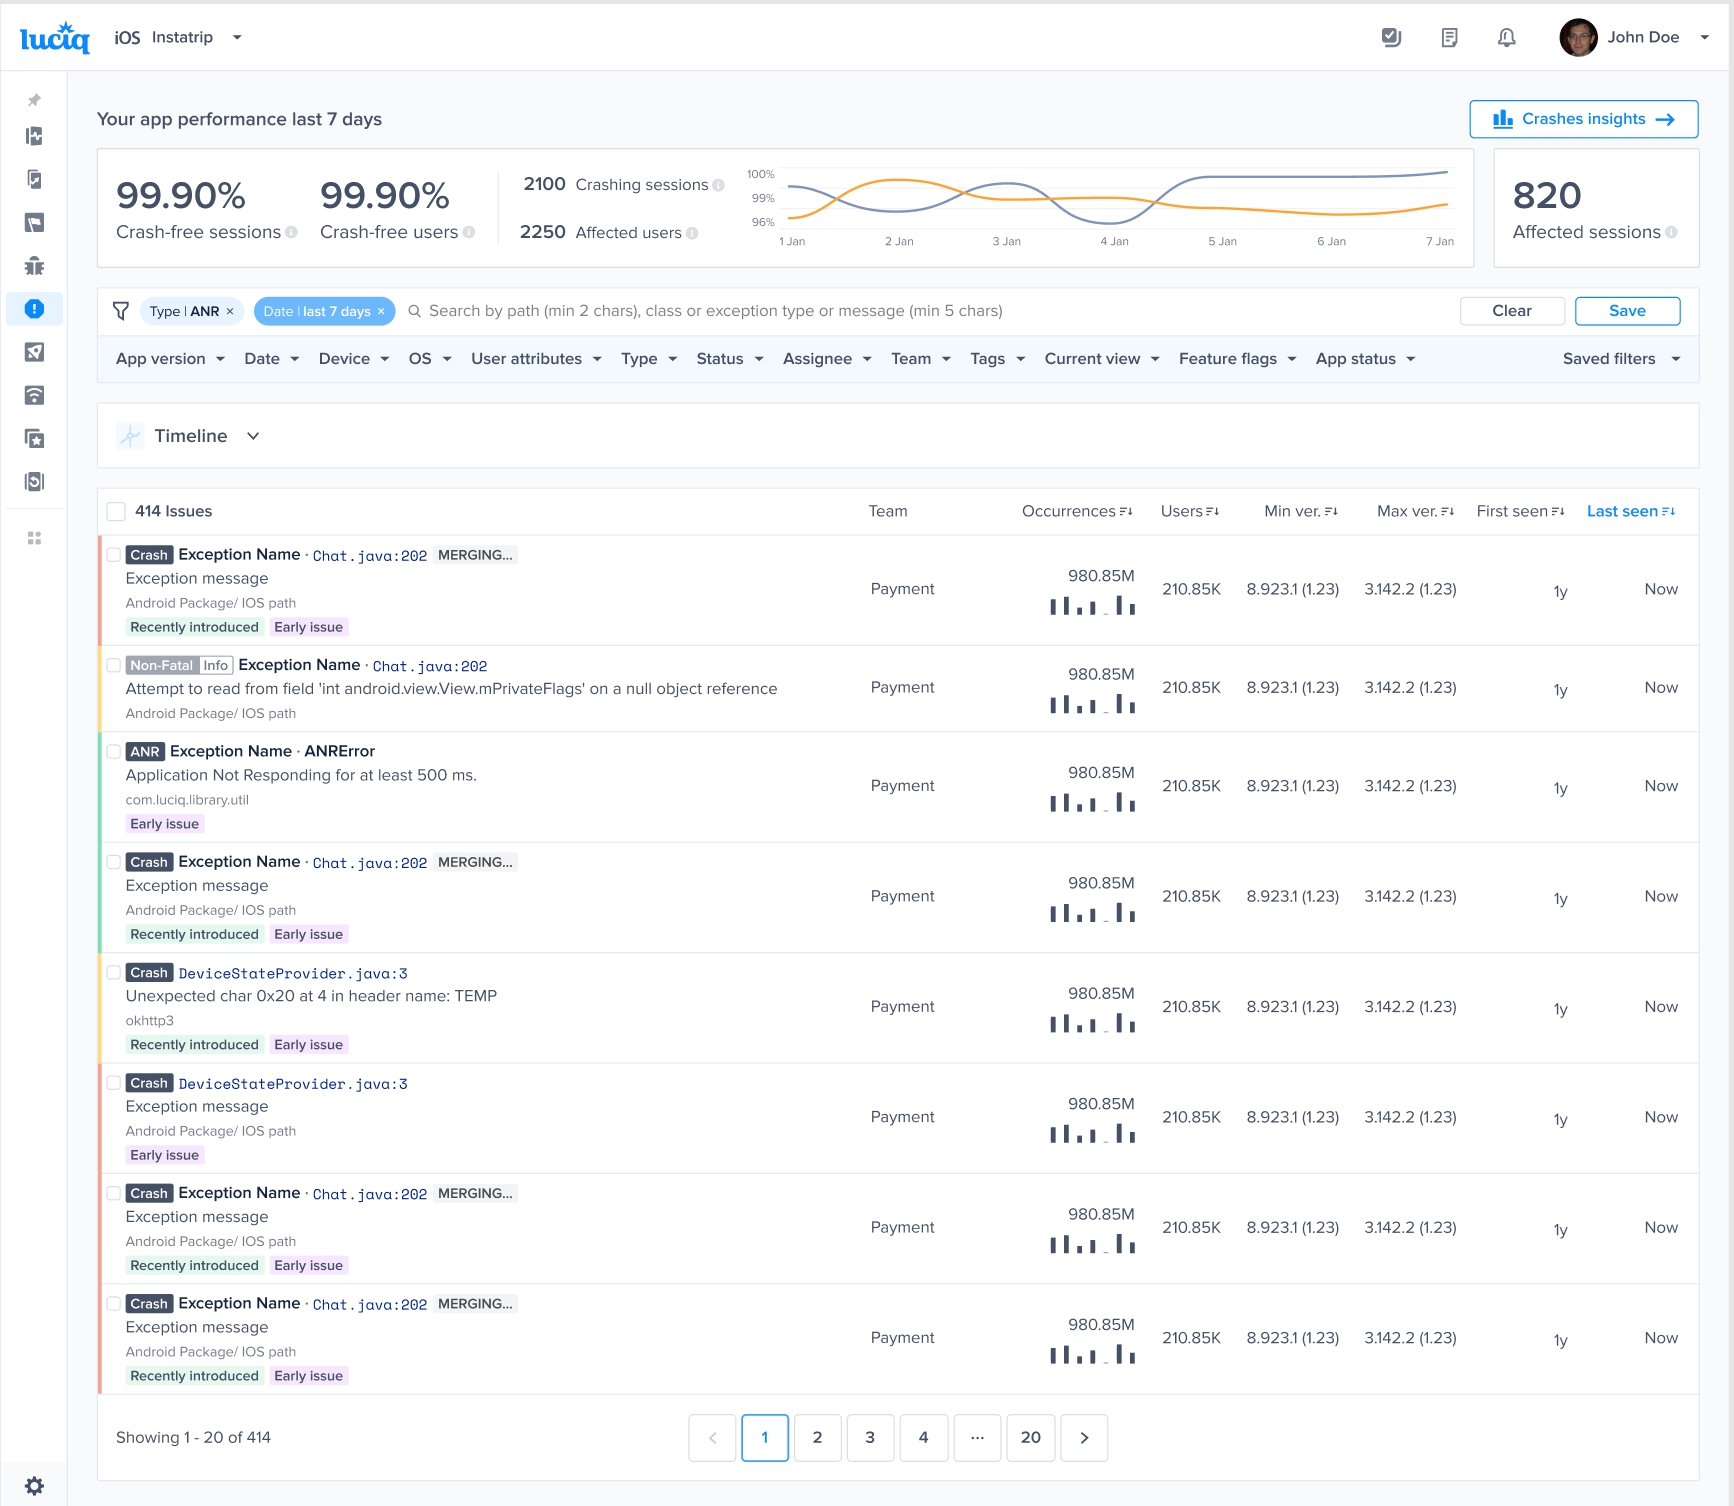
You'll also see the trends covering the previous 7 days, including:
Crash-free sessions: the percentage of sessions that ran and concluded without any fatal errors.
Crash-free users: the percentage of users that haven't encountered any fatal errors.
Crashing sessions: the number of sessions that ran and concluded with a fatal error.
Affected users: the number of unique users who had one or more sessions that ended with a fatal error.
Total number of occurrences: by hovering on it, you’ll get a breakdown of the total number of fatal sessions, the total number of OOM sessions, and the total number of non-fatal sessions.
If there is a sharp decline in the crash-free sessions rate, an email will be sent to notify you.
Out of Memory Crashes
By default, if Crash Reporting is enabled, Luciq captures OOM crashes, however, the crashes will not contain a stack trace and will only be captured if they happen while the app is in the foreground.
Force Restarts
Starting from SDK version 11.1.0, Luciq automatically reports Force Restarts. A Force Restart is when a user force terminates your application and re-launches it within 5 seconds, which could indicate performance issues.
App Hangs
Starting SDK version 10.13.0, Luciq automatically reports App Hangs. An App Hang is captured when the main thread is blocked for more than 3 seconds. App Hangs that last more than 3 seconds are considered severe and are likely to cause user frustration. They are reported along with a stack trace for debugging.
Warning
Crash reporting will not function correctly if the device is connected to Xcode. When it is, Xcode catches all exceptions and they will not be sent to your dashboard.
Grouping
When an already existing crash occurs once more for any user, that crash is reported as an occurrence in the original entry. However, in order to calculate whether a crash already exists and needs to be grouped, Luciq generates a fingerprint based on attributes used in the grouping logic.
The default Luciq grouping algorithm uses a mix of the exception and stack trace information. In some cases, you might want to change how the issues are grouped together using custom grouping or fingerprints.
Crash-to-Screen Assignment Logic
When a crash occurs during a screen transition, Luciq assigns the crash to a specific screen based on the timing of the viewDidAppear and viewDidDisappear lifecycle events. The crash will be attributed to the screen name that was last set by the SDK before the crash occurred.
Crashes List
This section contains a list of all the crashes that have been reported by your application. The title of each crash is usually the most significant line in the stack trace.
Next to each crash in the list, you can find the following details, all of which can be used to sort the crashes:
Occurrences: The number of times this crash has occurred and a bar graph representing its occurrences over the past seven days.
Users: The number of users affected by this crash.
Min ver.: The oldest app version that was affected by this crash.
Max ver.: The latest app version that was affected by this crash.
Last seen: The last time an occurrence of this crash was reported.
You can then filter for crashes that match any of the following criteria:
App version
Date
Device
OS
User attributes
Type
Status
Assignee
Team
Tags
Current view
Experiments
Last updated