

Screen Rendering
Detect Slow and Frozen Frames in your app’s screens and debug their root cause.
🚧 Minimum Required SDK Version
Screen Rendering is supported starting Luciq SDK version 19.0
Luciq automatically detects any frozen frames or slow frames that your users experience while using the app. These delayed frames and other critical debugging information is grouped automatically by screen. Learn which screens are experiencing the poorest rendering performance, understand what segments of users are impacted the most, and what spans and operations might’ve caused these issues down to the single occurrence level.
Metrics and Definitions
Luciq automatically detects when your app experiences these rendering issues:
Frozen Frame: Any frame that takes longer than 700 ms to render on devices running at 60 FPS.
This is a frustrating experience for your users and should not be tolerated on your app.
It also negatively impacts your Play Store ranking.
Slow Frame: Any frame that takes longer than 16 ms to render on devices running at 60 FPS.
This threshold changes according to the refresh rate of the device; it is calculated as (1/refresh rate) seconds.
The Luciq SDK automatically detects the refresh rate and dynamically adjusts this threshold for different devices and configurations.
For each screen visit, Luciq aggregates this data into the following metrics:
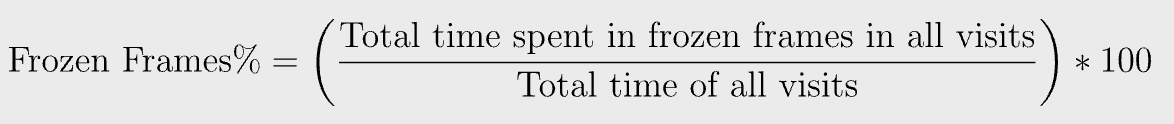
Frozen Frames %: The percentage of total time users spent on the screen that was spent in a Frozen Frame.
Example: if a user spent a total of 10s on a screen, within which they experienced a 2s frozen frame, this screen will have a Frozen Frames % of (2/10) = 20%
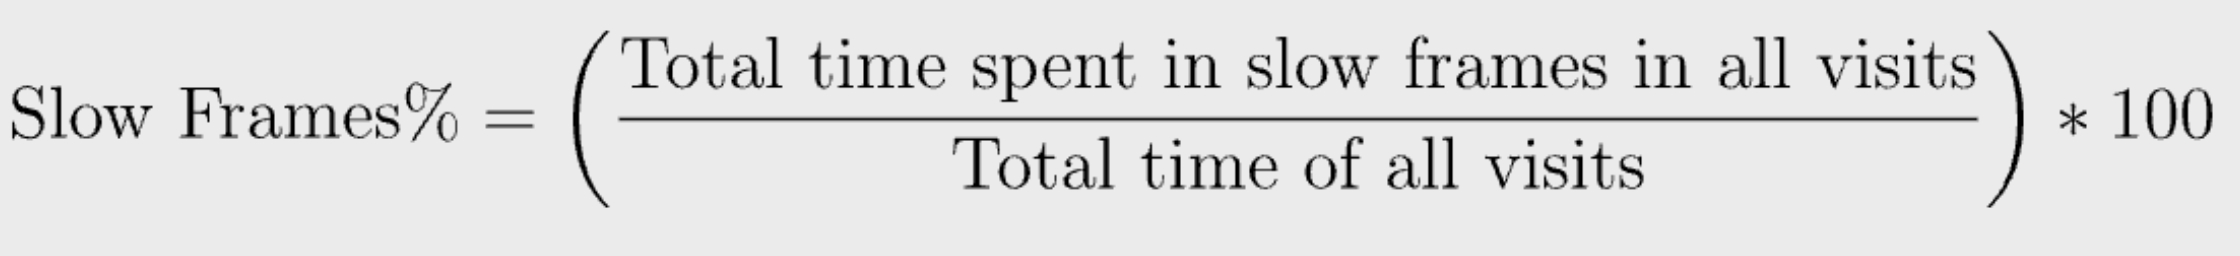
Slow Frames %: The percentage of total time users spent on the screen that was spent in a Slow Frame.
Example: if a user spent a total of 10s on a screen, within which they experienced a total of 1s in slow frames, this screen will have a Slow Frames % of (1/10) = 10%
Features
Trends
Understand your screen’s rendering performance over time.
Track your screen’s rendering Apdex over time.
Analyze throughput to understand user traffic on that screen.
Monitor Frozen frames and Slow Frames over time to identify spikes.
View distribution graphs to understand how frequent different severities of slow and frozen frames are happening on the screen.
Suspect Spans
Identify spans that most commonly correlate with Slow and Frozen Frames. These spans are likely root causes of rendering issues on this screen.
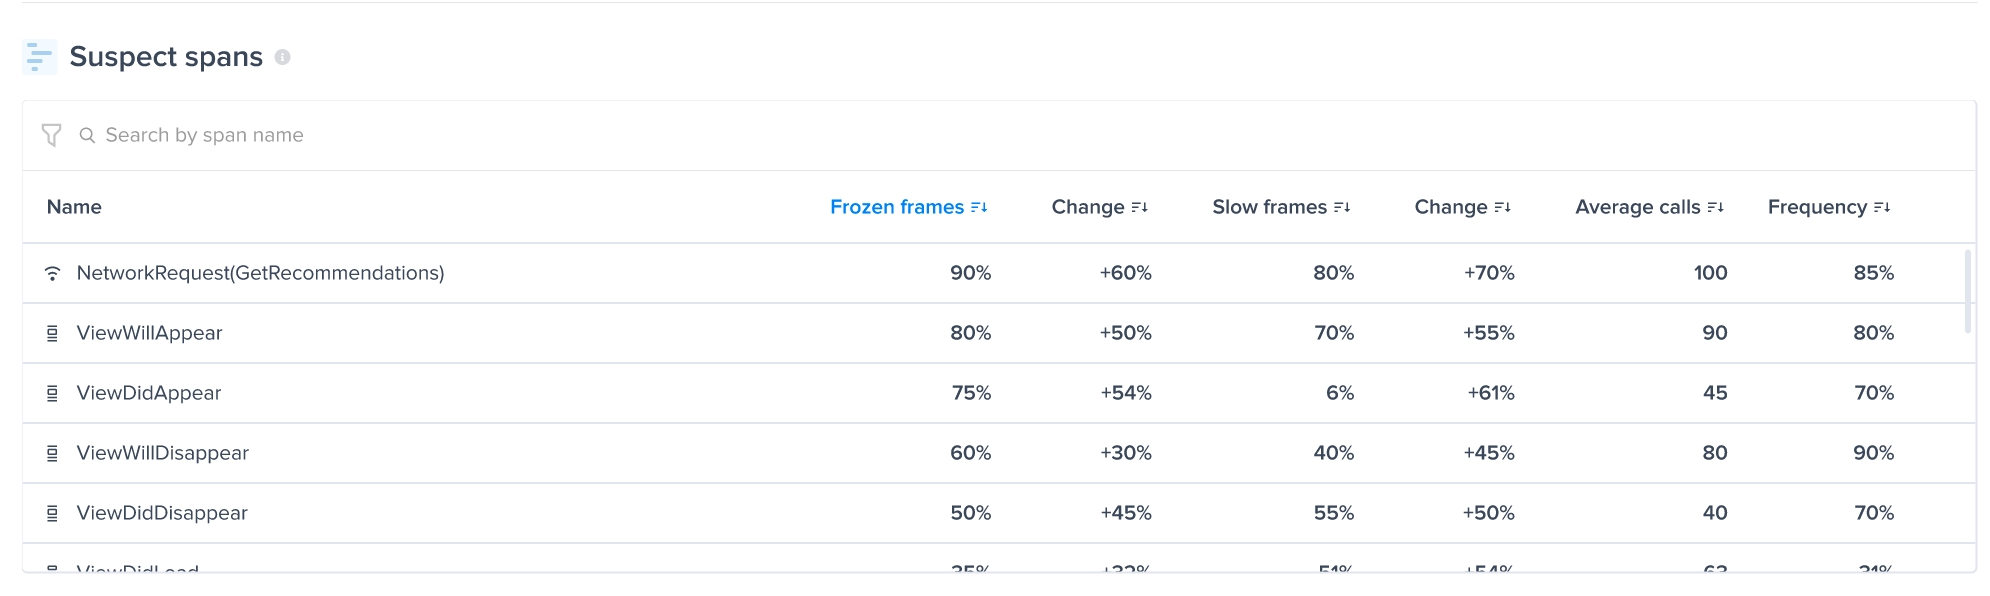
The suspect spans table shows for every span captured on this screen:
Frozen Frames %: What percentage of the occurrences of this span correlated with a frozen frame.
Slow Frames %: What percentage of the occurrences of this span correlated with a slow frame.
Change: How each of those percentages changed in the selected date period compared to the previous period of the same length.
Learn more about spans and how they can help you identify the root cause of performance issues in the documentation: https://docs.luciq.ai/docs/android-apm-instrumentation
Patterns
Understand your rendering performance across different dimensions: App versions, Devices, OS versions, etc., allowing you to narrow down into segments of your user base to identify and debug issues.
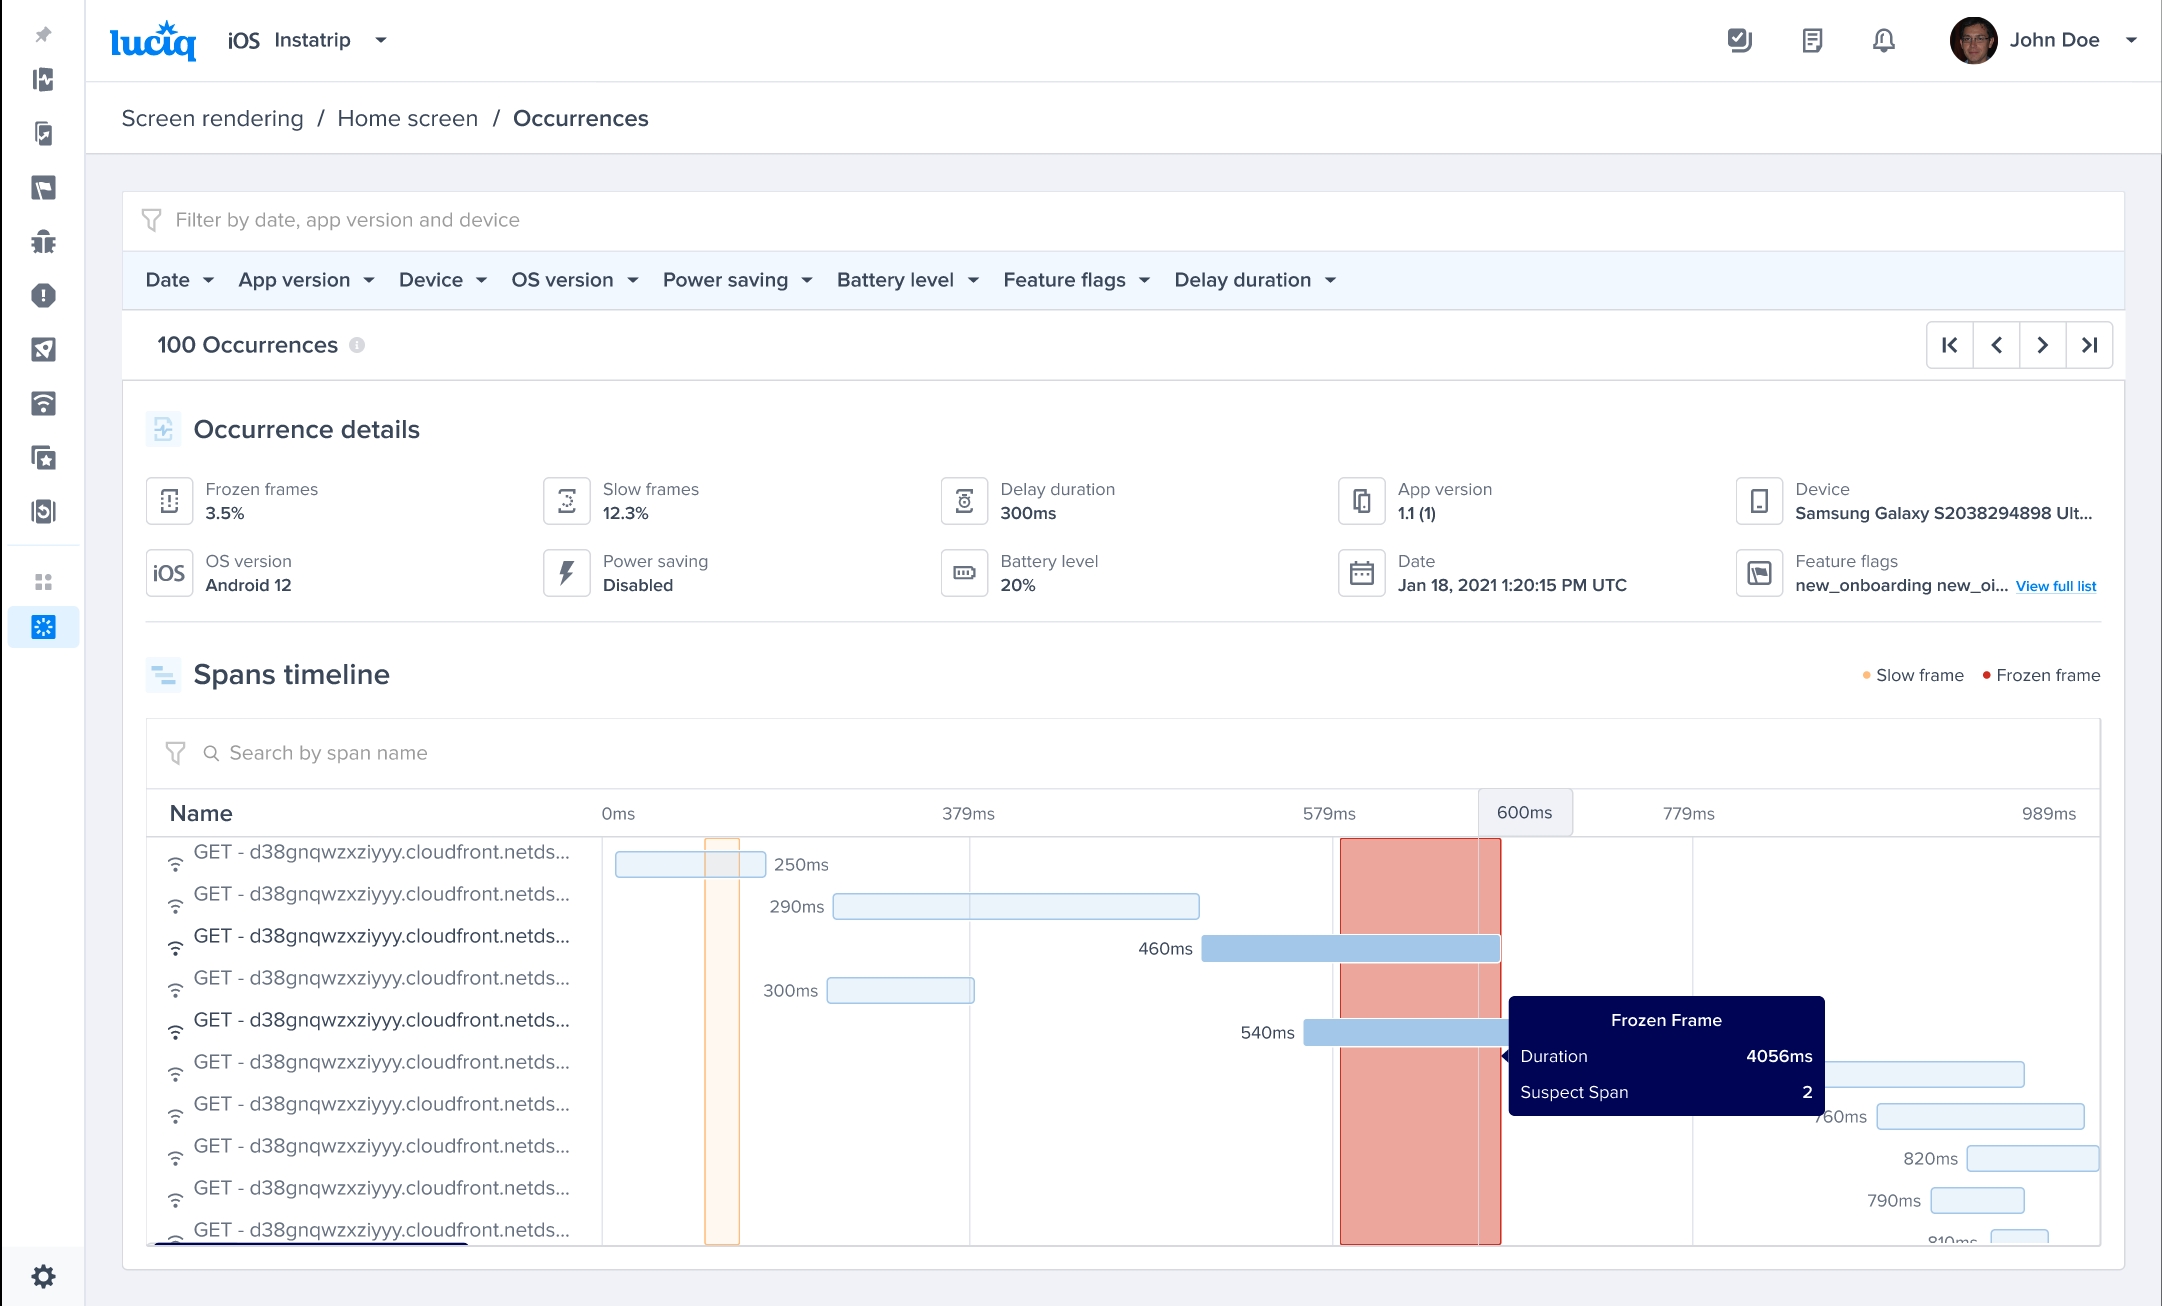
Occurrence View
Navigate to the occurrences page of any screen to view individual screen visit occurrences in full detail.
View metadata about each occurrence, including frozen and slow frames %, device and app information, and other parameters.
View a detailed span timeline of the complete screen visit, highlighting frozen frames (in red) and slow frames (in yellow).
Hover over any frozen or slow frame to highlight that frame’s suspect spans, a likely root cause of this rendering delay.
Apdex Calculation
Luciq calculates an Apdex score that reflects the rendering performance of every screen or custom UI trace of your application. An Apdex score ranges between 0 and 1; the higher the value, the better the performance:
Apdex score ≥ 0.94 — Excellent
Apdex score ≥ 0.85 and < 0.94 — Good
Apdex score ≥ 0.7 and < 0.85 — Fair
Apdex score ≥ 0.5 and < 0.7 — Poor
Apdex score < 0.5 — Unacceptable
The following color-code criteria is also applied:

How is the Screen Rendering Apdex Calculated?
Every screen visit is categorized based on the frozen frames % and slow frames % of that occurrence using the logic shown below:
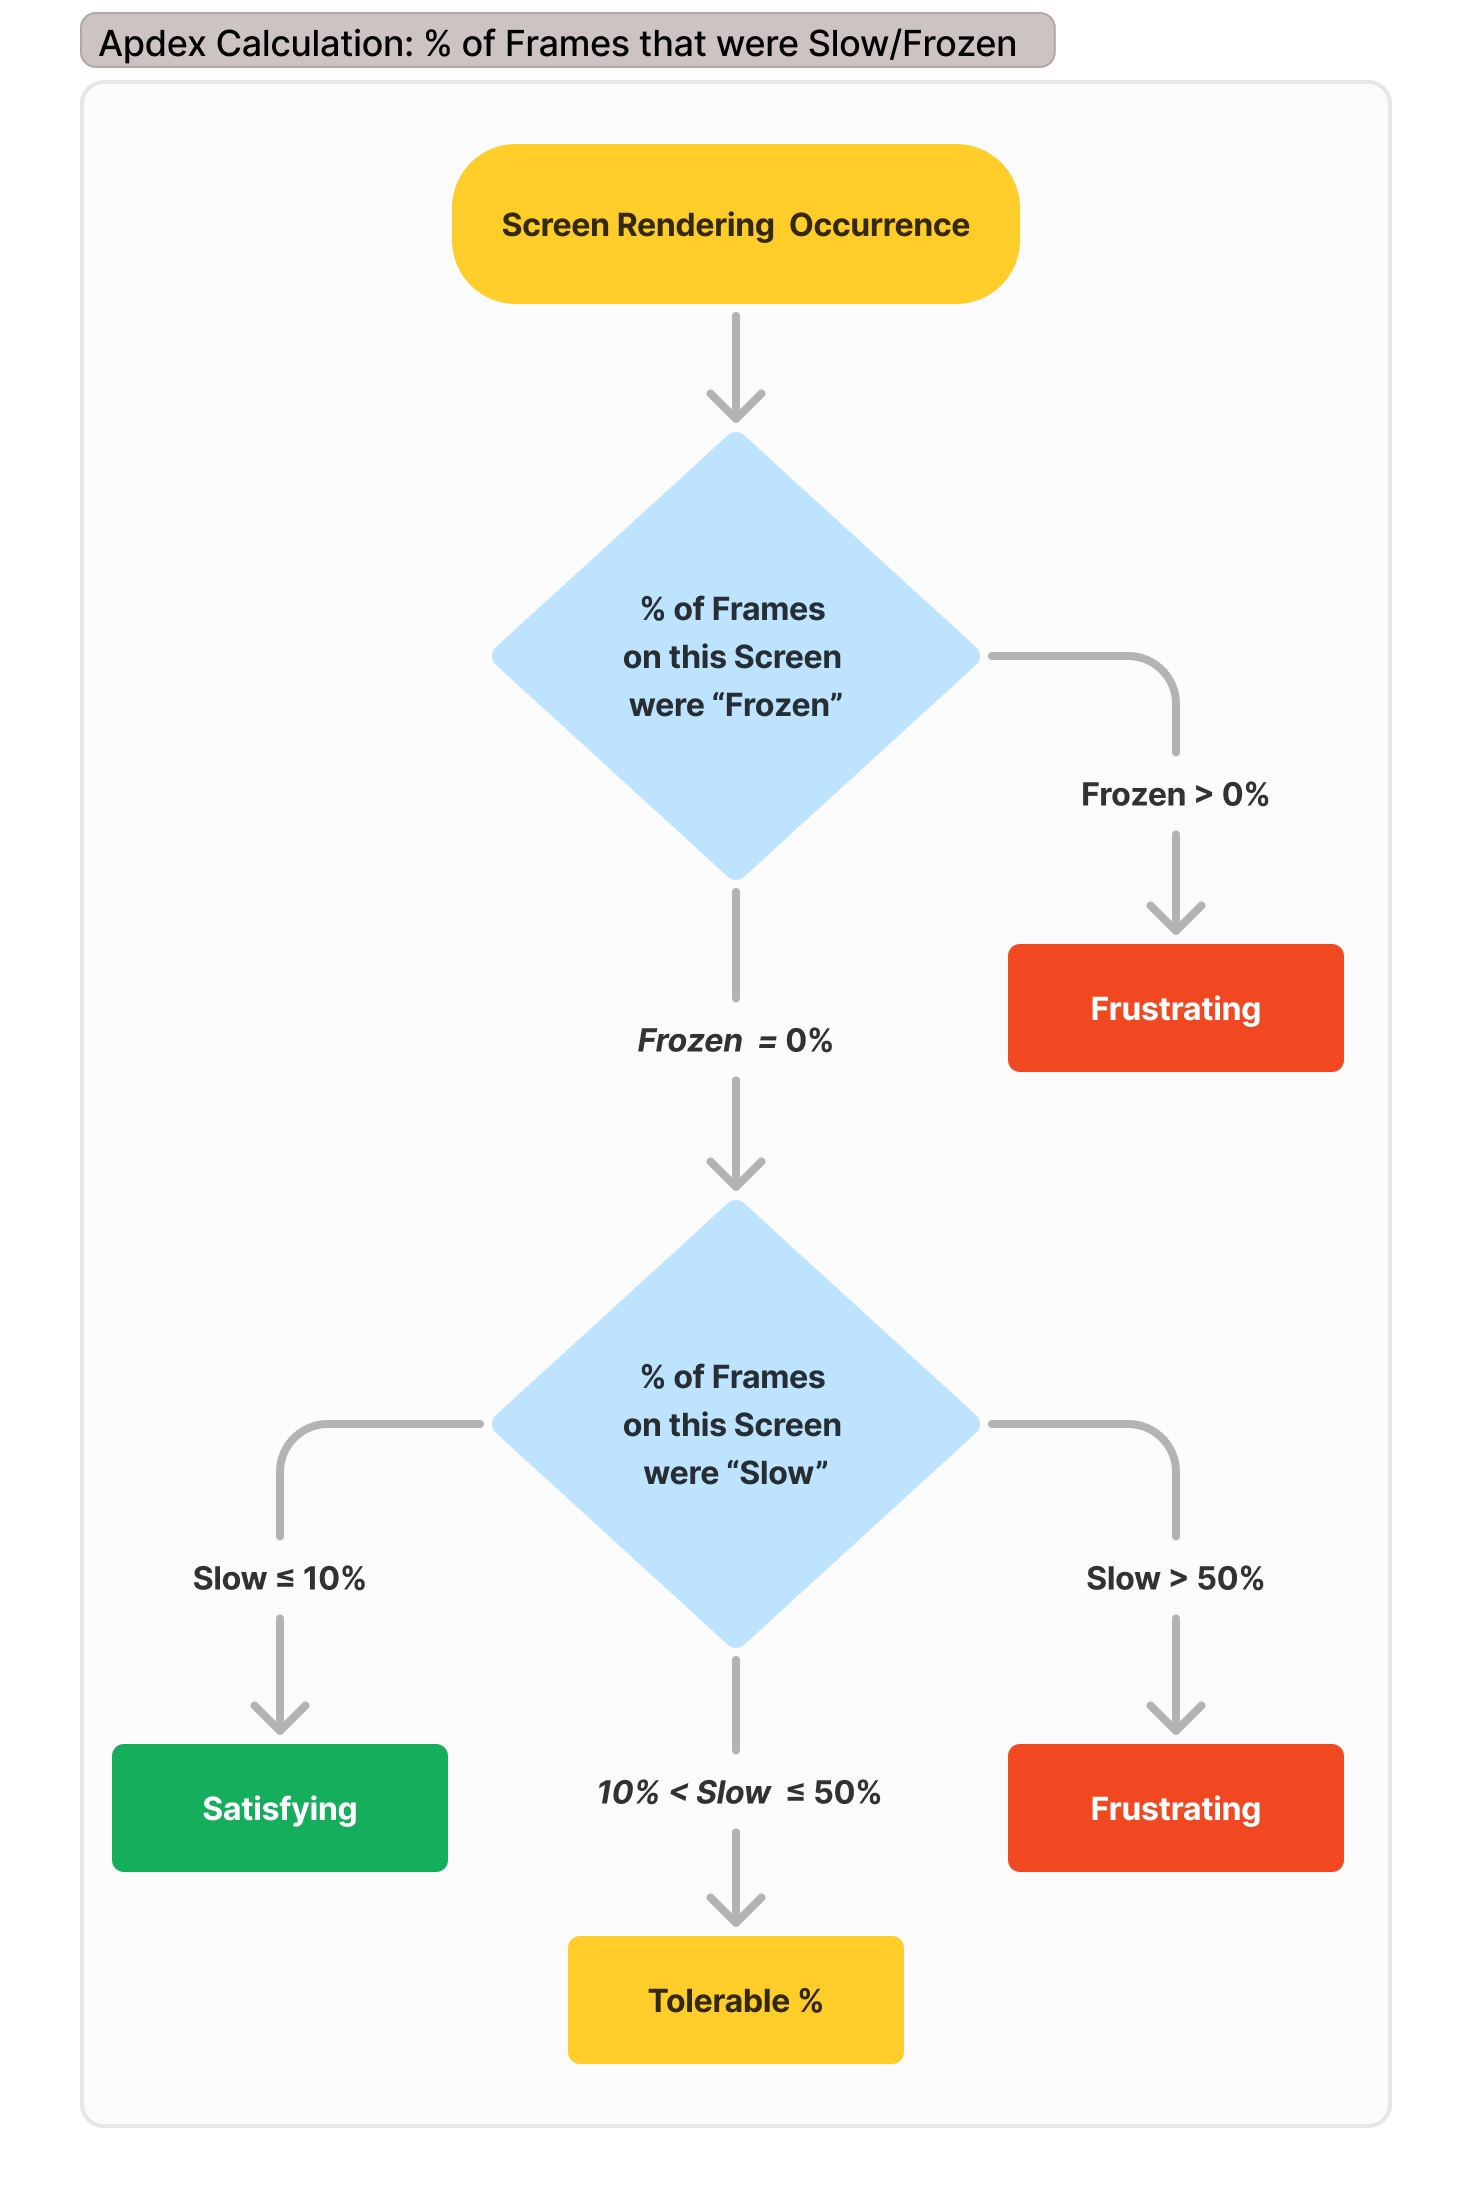
Following that logic, a Screen rendering occurrence is considered:
Satisfying: if it has NO frozen frames & ≤ 10% Slow frames.
Tolerable: if it has NO frozen frames & ≤ 50% Slow Frames.
Frustrating: if it has ANY frozen frames & > 50% Slow Frames.
Screen Group Apdex Calculation
The Apdex score for the entire Screen Rendering group is then calculated as follows:
Apdex score = (Satisfying occurrences + 0.5 * Tolerable occurrences) / Total occurrences
Where Total occurrences = Satisfying occurrences + Tolerable occurrences + Frustrating occurrences
Example occurrences:
Apdex for that screen = (Satisfying occurrences + 0.5 * Tolerable occurrences) / Total occurrences = (1 + 0.5 * 1) / 3 = 0.5
Last updated