Reporting Crashes
Covered here are APIs relevant to reporting crashes.
Privacy Policy
It is highly recommended to mention in your privacy policy that you may be collecting logging data in order to assist with troubleshooting crashes.
There are two ways to have your application report a crash, either automatically or manually. After the crash is sent to your dashboard, you can sort and filter for specific crashes easily.
Automatic Crash Reporting
If you enable Crash Reporting, crashes will automatically be reported to and viewable from the crashes page of your Instabug dashboard.
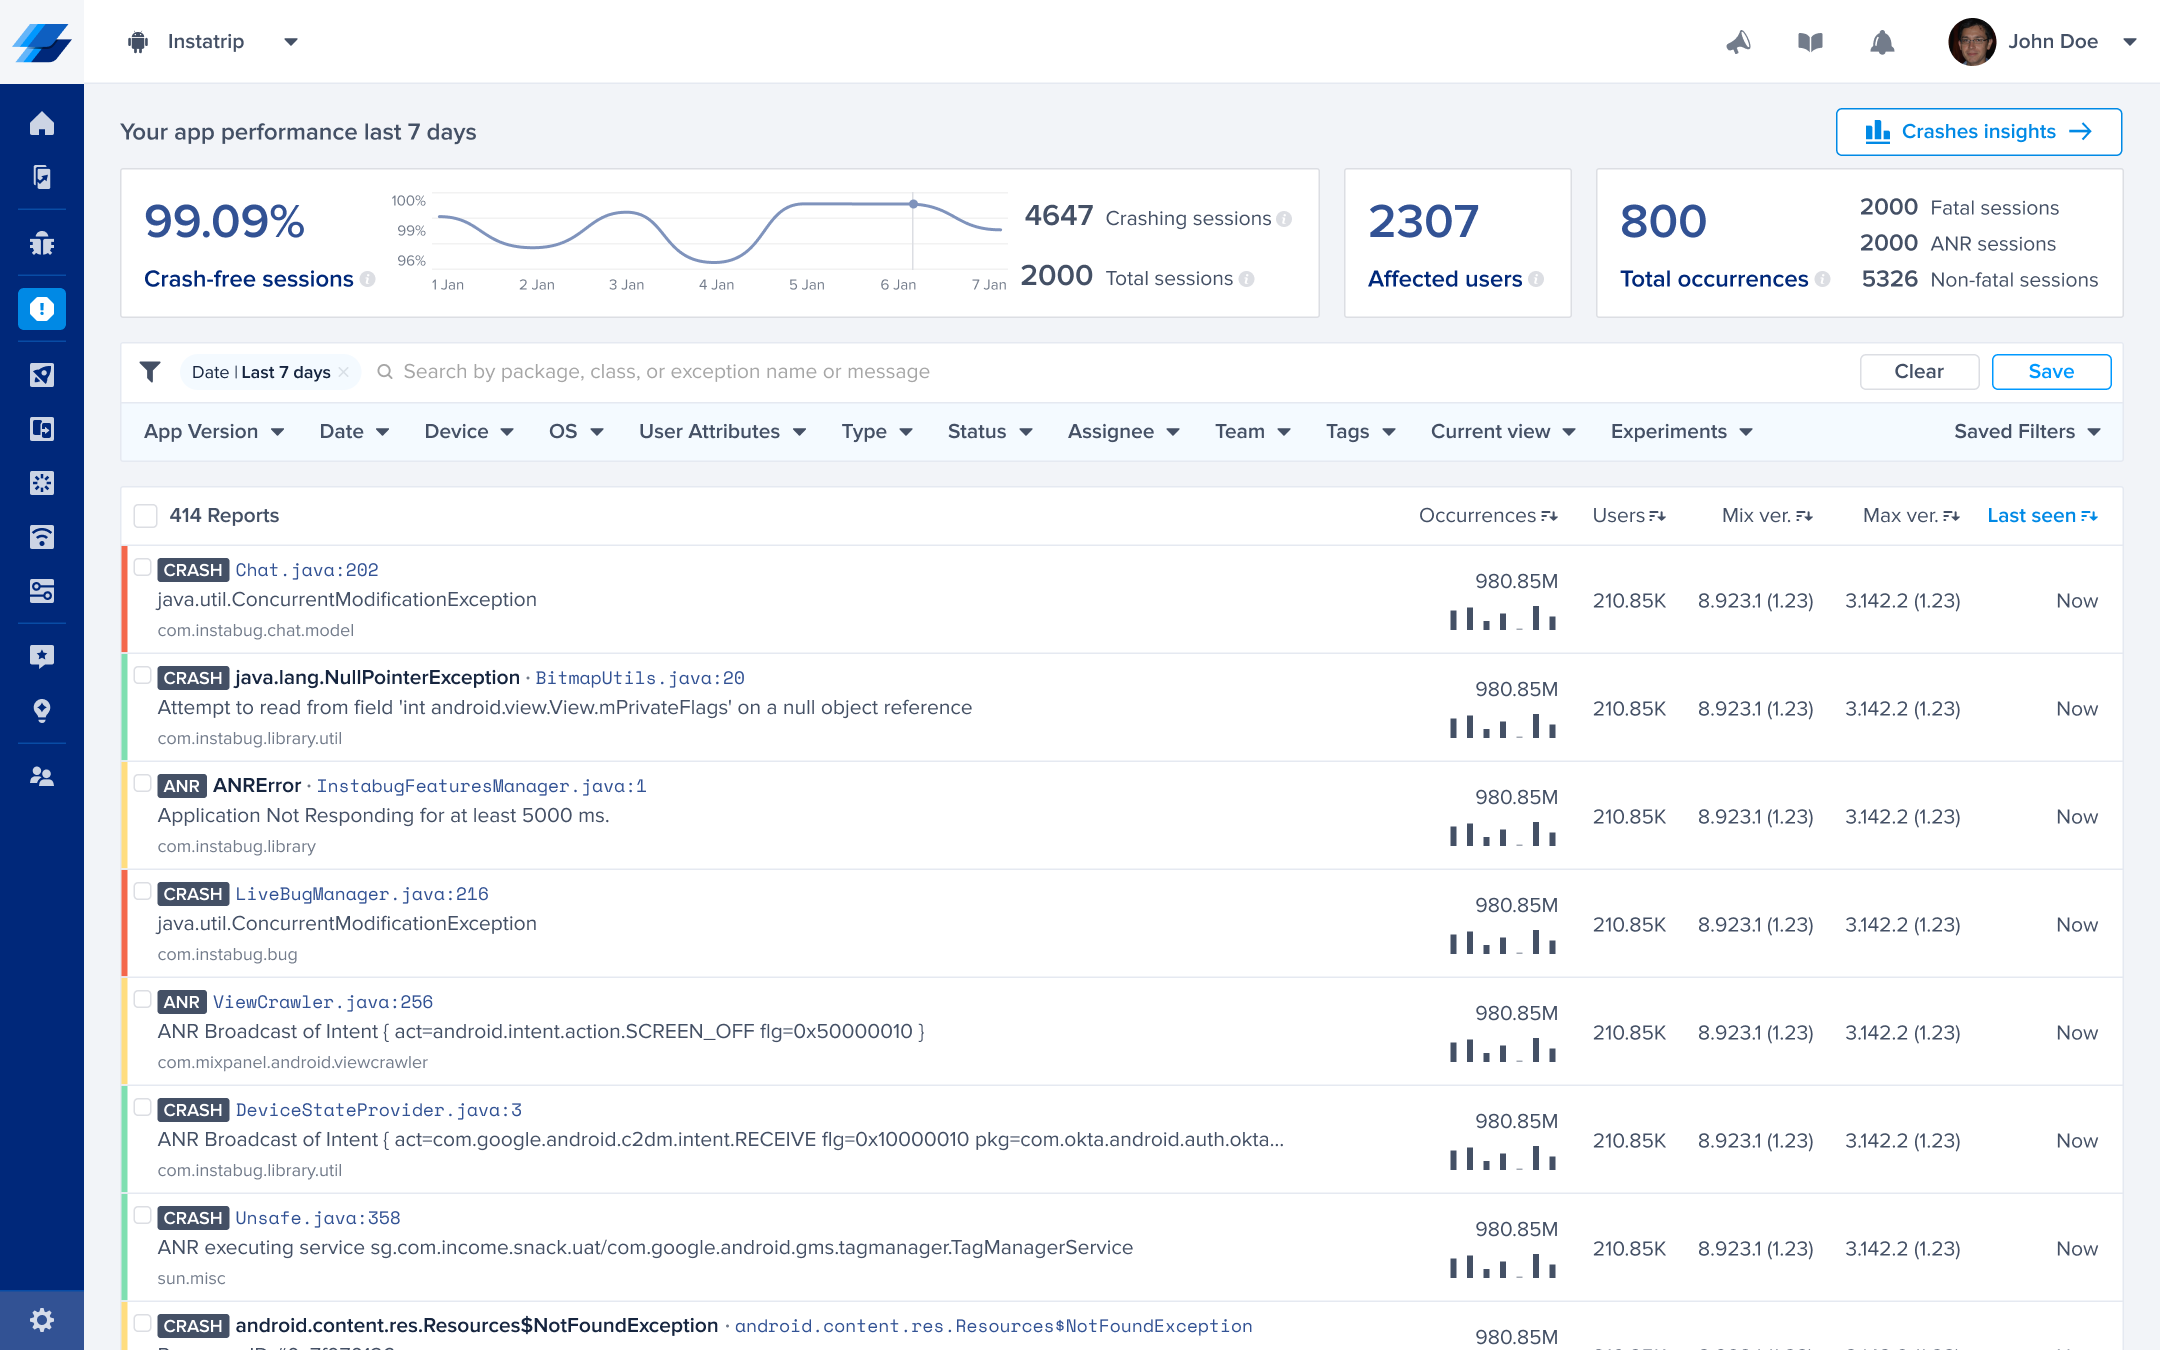
You'll also see the trends covering the previous 7 days for the percentage of crash-free sessions (sessions that ran and concluded without any fatal errors), the total number of crashing sessions, the total number of sessions, and the total number of unique affected users. You can also see the total number of occurrences, the total number of fatal sessions, the total number of ANRs, and the total number of non-fatal errors. If there is a sharp decline in the crash-free sessions rate, an email will be sent to notify you.

This is the crashes page of the Instabug dashboard.
ANR Crashes
By default, if Crash Reporting is enabled, Instabug captures any ANR that occurs within your app, along with the stack trace of the crash.
You can disable/enable ANR reporting using the following API:
CrashReporting.setAnrState(Feature.State.DISABLED);
CrashReporting.setAnrState(Feature.State.DISABLED)
Manual Crash Reporting
You can use the following method and API to manually report any error or exception that you handle in your code and assign it a severity level.
Report Exception
To report exceptions manually, use the following method; Both errors and exceptions can be passed to this method:
IBGNonFatalException exception = new IBGNonFatalException.Builder(new NullPointerException("Test Exception"))
.setUserAttributes(new HashMap<>())
.setFingerprint("My Custom Fingerprint")
.setLevel(IBGNonFatalException.Level.CRITICAL)
.build();
CrashReporting.report(exception);
val exception = IBGNonFatalException.Builder(NullPointerException("Test Exception"))
.setUserAttributes(mapOf("height" to "tall"))
.setFingerprint("My Custom Fingerprint")
.setLevel(IBGNonFatalException.Level.CRITICAL)
.build()
CrashReporting.report(exception)
Here is another example:
IBGNonFatalException.Builder(NullPointerException("Test Exception"))
.setUserAttributes(mapOf("height" to "tall"))
.setFingerprint("My Custom Fingerprint")
.setLevel(IBGNonFatalException.Level.CRITICAL)
.build().let { exception -> CrashReporting.report(exception) }
Add Level to Exception
You can set different severity levels for manually reported exceptions using the following API:
IBGNonFatalException exception = new IBGNonFatalException.Builder(new NullPointerException("Test Exception"))
.setLevel(IBGNonFatalException.Level.CRITICAL)
.build();
CrashReporting.report(exception);
val exception = IBGNonFatalException.Builder(NullPointerException("Test Exception"))
.setLevel(IBGNonFatalException.Level.CRITICAL)
.build()
CrashReporting.report(exception)
Here are the different severity levels available. In case no level is indicated, the default level would be ERROR
IBGNonFatalException.Level.WARNING
IBGNonFatalException.Level.ERROR
IBGNonFatalException.Level.CRITICAL
IBGNonFatalException.Level.INFO
NDK Crashes
In the events that you're using a C++/NDK library or have code that runs at C++ level, the Instabug SDK will automatically detect and capture these low level crashes.
Adding the NDK Crashes Dependency
In order to start capturing NDK crashes, you'll need to add the below dependency to your app level gradle. Once it's added and the gradle is synced, NDK crashes will automatically be captured after the SDK is initialized and NDK crash reporting is enabled.
implementation 'com.instabug.library:instabug-ndk-crash:11.3.0'
Enabling and Disabling
NDK crash reporting is disabled by default if the NDK dependency is added, however it can be enabled using the below method.
CrashReporting.setNDKCrashesState(Feature.State.ENABLED);
CrashReporting.setNDKCrashesState(Feature.State.ENABLED)
Deobfuscation
Since native code is always obfuscated, you'll need to follow the instructions mentioned in the deobfuscation page in order to make the stack traces more readable.
Grouping
When an already existing crash occurs once more for any user, that crash is reported as an occurrence in the original entry. However, in order to calculate whether a crash already exists and needs to be grouped, Instabug generates a fingerprint based on attributes used in the grouping logic.
The default Instabug grouping algorithm uses a mix of the exception and stack trace information. In some cases, you might want to change how the issues are grouped together using custom fingerprints.
Custom Fingerprinting
Overriding the default grouping
Please note that using custom fingerprinting will override Instabug's default grouping by sending a fingerprint string.
In the event that you'd like to report the exception manually with a custom grouping fingerprint in mind, you can use the below APIs to do just that.
CrashReporting.reportException(throwable, "exception identifier", userAttrsMap, "grouping fingerprint");
CrashReporting.reportException(throwable, "exception identifier", userAttrsMap, "grouping fingerprint")
Crashes List
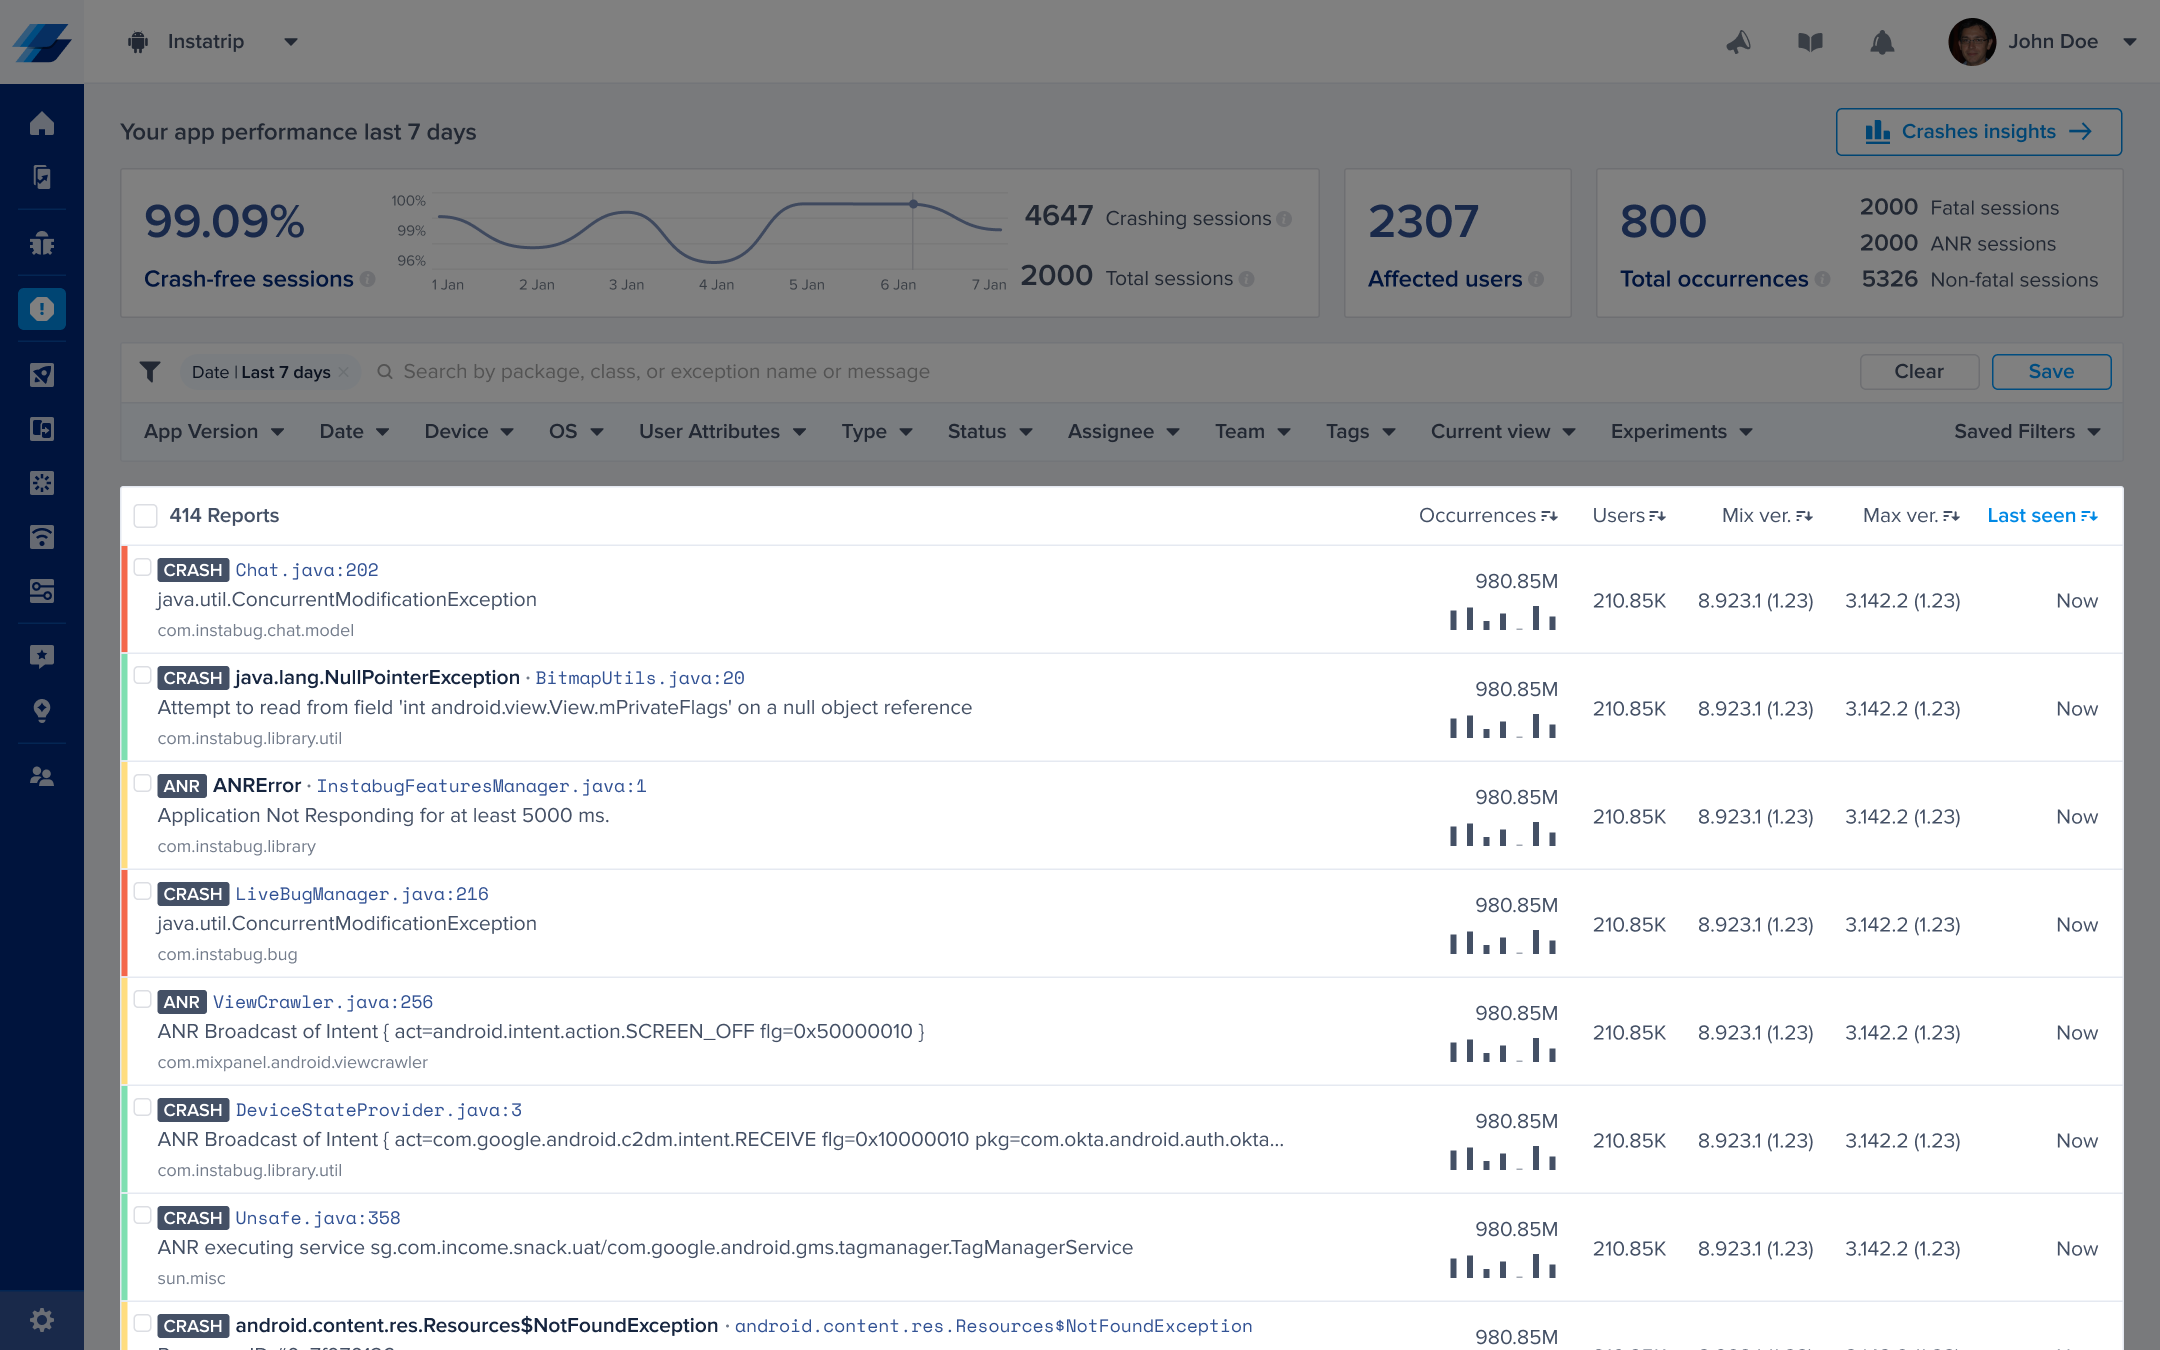
This section contains a list of all the crashes that have been reported by your application. The title of each crash is usually the most significant line in the stack trace.

An example of the list of crashes in the crashes page of the Instabug dashboard.
Next to each crash in the list, you can find the following details, all of which can be used to sort the crashes:
- Occurrences: The number of times this crash has occurred and a bar graph representing its occurrences over the past seven days.
- Users: The number of users affected by this crash.
- Min ver.: The oldest app version that was affected by this crash.
- Max ver.: The latest app version that was affected by this crash.
- Last seen: The last time an occurrence of this crash was reported.
You can then filter for crashes that match any of the following criteria:
- App version
- Date
- Device
- OS
- User attributes
- Type
- Status
- Assignee
- Team
- Tags
- Current view
- Experiments
Updated about 3 years ago
Learn more about the content contained in crash reports as well as how to deobfuscate them. You can also use callbacks to collect additional information.
