

Setup Flows
Flows provides visibility on the health and performance of the most important user flows in your application. Flows gives you consolidated view of the health and performance of your app's most important flows. With simple instrumentation, you can measure the time it takes users to complete key user journeys, understand completion and drop-off rates as well as their root causes, learn what crashes are affecting your flows, and gain insight into the various spans and operations occurring within those flows and their performance.
Features
Flow Summary
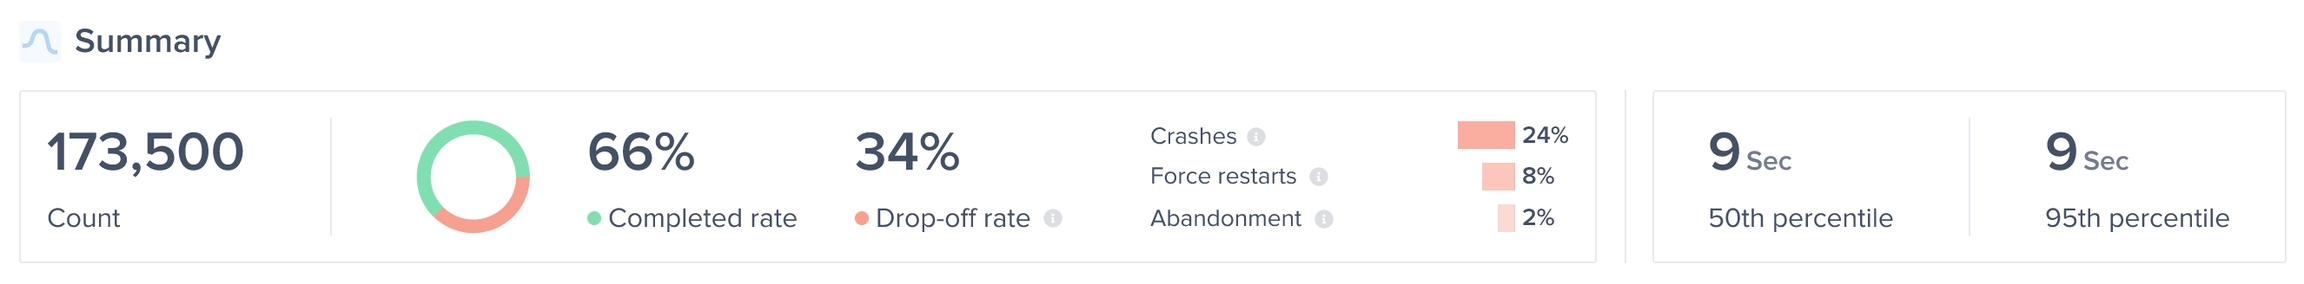
Flows provides an “at a glance” summary of your flow’s performance and user behavior:
Count: How many times did your users start this flow or user journey.
Completion Rate: How often do your users complete this flow once they started it.
Drop-off Rate: How often do your users abandon this flow mid-way without seeing it to completion. You can also see a breakdown of the drop-off cause, which could be due to:
Crashes: Your app crashed, preventing your user from completing this flow.
Forced-Restarts: Your users closed the app only to reopen it within 5 seconds. This often indicates that the user faced a frustrating experience and was forced to restart the app to make it go away.
Abandonments: Users quitting this flow or your app entirely before reaching the end of the flow. An ongoing flow is considered abandoned if the app stays in the background for more than 60 seconds.
Time to completion: Understand how long this flow usually takes your users to complete with P50 (median) and P95 (slowest occurrence that’s not an outlier) insights.
Trends
Understand how your flow’s performance changes over time.
Track your flow’s Apdex and P50 to detect performance regressions,
Analyze throughput to understand user traffic on this flow, or
View distribution graph to get a wider view of this flow’s performance.
Spans
Learn what spans are most impacting your flow’s completion time or introducing latency.
Flutter only supports Network spans.
You can learn more about spans and how they can help you identify the root cause of performance issues here.
Crashes
Identify the top crashes affecting users on that flow that might be causing them to drop-off.
Patterns
Understand how your flows are performing across different dimensions: App versions, Devices, OS versions, etc. or custom flow attributes that you can set yourself, allowing you to narrow down into segments of your user base to identify and debug issues.
Instrumentation
To create a flow you just need to define a start and an end for that flow in your code. Luciq automatically captures data health and performance data between those two points. All instances of flows with the same name are aggregated on your dashboard.
Rules around creating Flows:
Flows are uniquely identified by their name.
You can run several flow with different names in parallel.
You can’t run different instances of the same flow in parallel.
You can start a flow while your app is in the background.
You can’t end a flow while your app in the background.
You can create up to 10,000 unique Flows.
Start a Flow
To mark the beginning of a Flow, add the following API call to your code:
This API call initiates an instance of a flow named “flowName”. If any other instances of the same flow are already started and weren’t ended yet, they are considered drop-offs.
Naming Limitation for Flows:
Flow name can be up to 150 characters. Any extra characters are truncated.
Flow name can't be null or an empty string.
Avoid adding any of these special characters [, (, ), =, {, }, <, >, /, , ] (commas not included) as they will be replaced with _.
Adding Custom Flow Attributes
Luciq automatically attaches some attributes like app version, OS version, and device to all Flows. You can use those attributes to drill-down and find insightful patterns in your data (e.g . if a performance problem is related to a specific device model).
For advanced analysis, you can create your own custom attributes and attach them to any flow. This step is optional but can provide valuable context for debugging specific user segments or behaviors.
This API call creates a new custom attribute called “key” with the value “value” and attaches it to the flow “flowName”.
When using custom attributes that can have a large number of unique values, please group those values into buckets. Using a massive number of unique values can negatively impact your dashboard’s performance.
Rules and Limitations for Custom Flow Attributes:
The attribute's key can be up to 30 characters.
The attribute's value can be up to 60 characters.
Avoid adding any of these special characters [, (, ), =, {, }, <, >, /, , ] (commas not included) as they will be replaced with _.
You can add up to 5 unique custom attributes to each flow instance.
You can have up to 20 unique custom attribute keys across all instances of a flow.
The attribute's key can't be an empty string or null.
The attribute's value can't be an empty string.
You can call the API twice with the same key to override a previous value.
Setting a attribute value to null will remove the attribute from the flow.
Last updated