> For the complete documentation index, see [llms.txt](https://docs.luciq.ai/llms.txt). Markdown versions of documentation pages are available by appending `.md` to page URLs; this page is available as [Markdown](https://docs.luciq.ai/product-guides-and-integrations/product-guides/crash-reporting/flame-graphs.md).
# Flame Graphs
Flame graphs visualize the stack traces behind ANRs and App Hangs, showing which functions appear most so you can find the bottleneck.
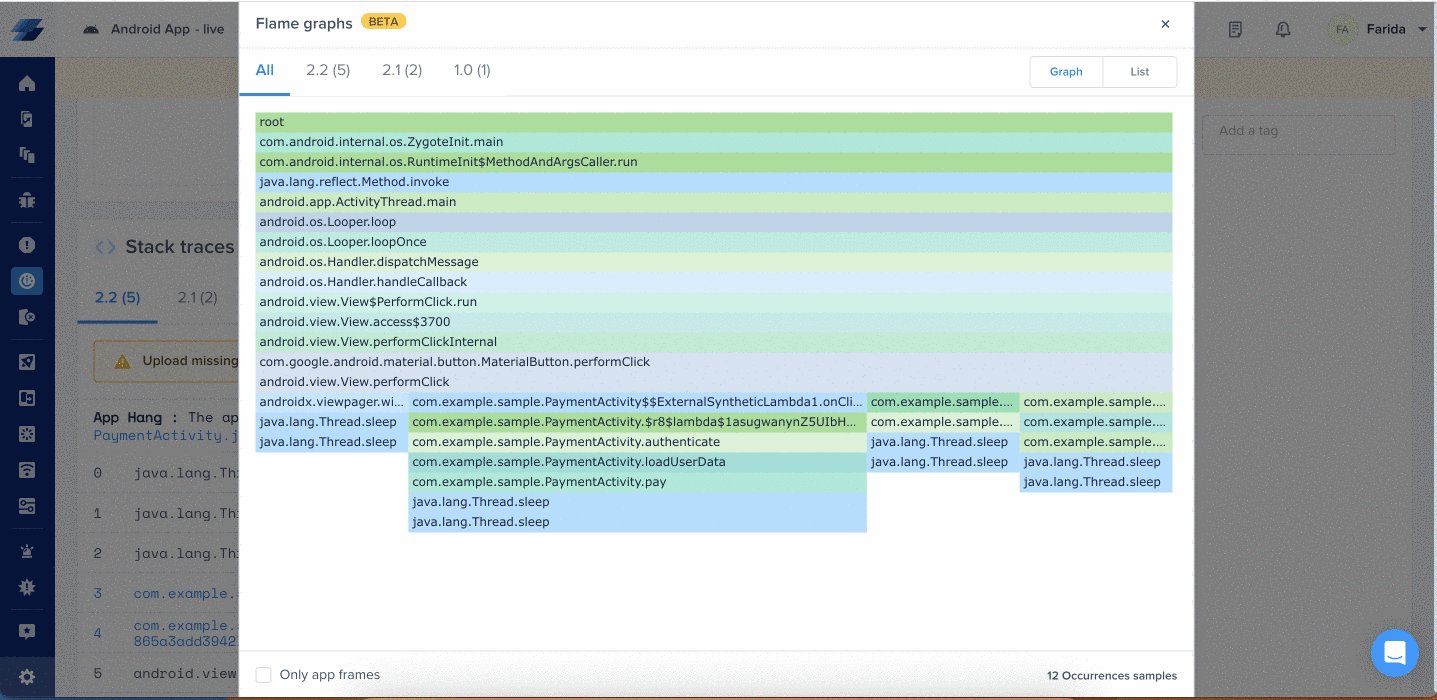
Flame graphs are visualization tools that help analyze and debug performance issues, such as Application Not Responding (ANR) errors and App Hangs. The display stack traces of an ANR or an App Hang, showing how many times each function appears in the occurrences of the issue. By identifying the functions that are called the most, developers can pinpoint bottlenecks and optimize performance to resolve ANR problems.To analyze a flame graph effectively, look for functions with wide boxes that consume a significant portion of the graph. The closer these boxes are to where the ANR happened, the more likely that these functions indicate potential performance bottlenecks or areas where optimization is needed. By focusing on optimizing these critical functions, you can address ANR issues and improve the overall performance of your applicationYou can [learn about Flame Graphs here.](https://www.brendangregg.com/flamegraphs.html)
#### How can Flame Graphs help you?
Along with the available debugging data that comes with ANRs and [App Hangs](/product-guides-and-integrations/product-guides/crash-reporting/app-hangs.md), you can debug those frustrating experiences by seeing the visual aggregations of the stack traces. You can also find the code paths that are frequently associated with the hangs so you can debug them to improve your app’s performance and user experience.Example:Imagine you get a 100 occurrences of an app hang on a certain screen.
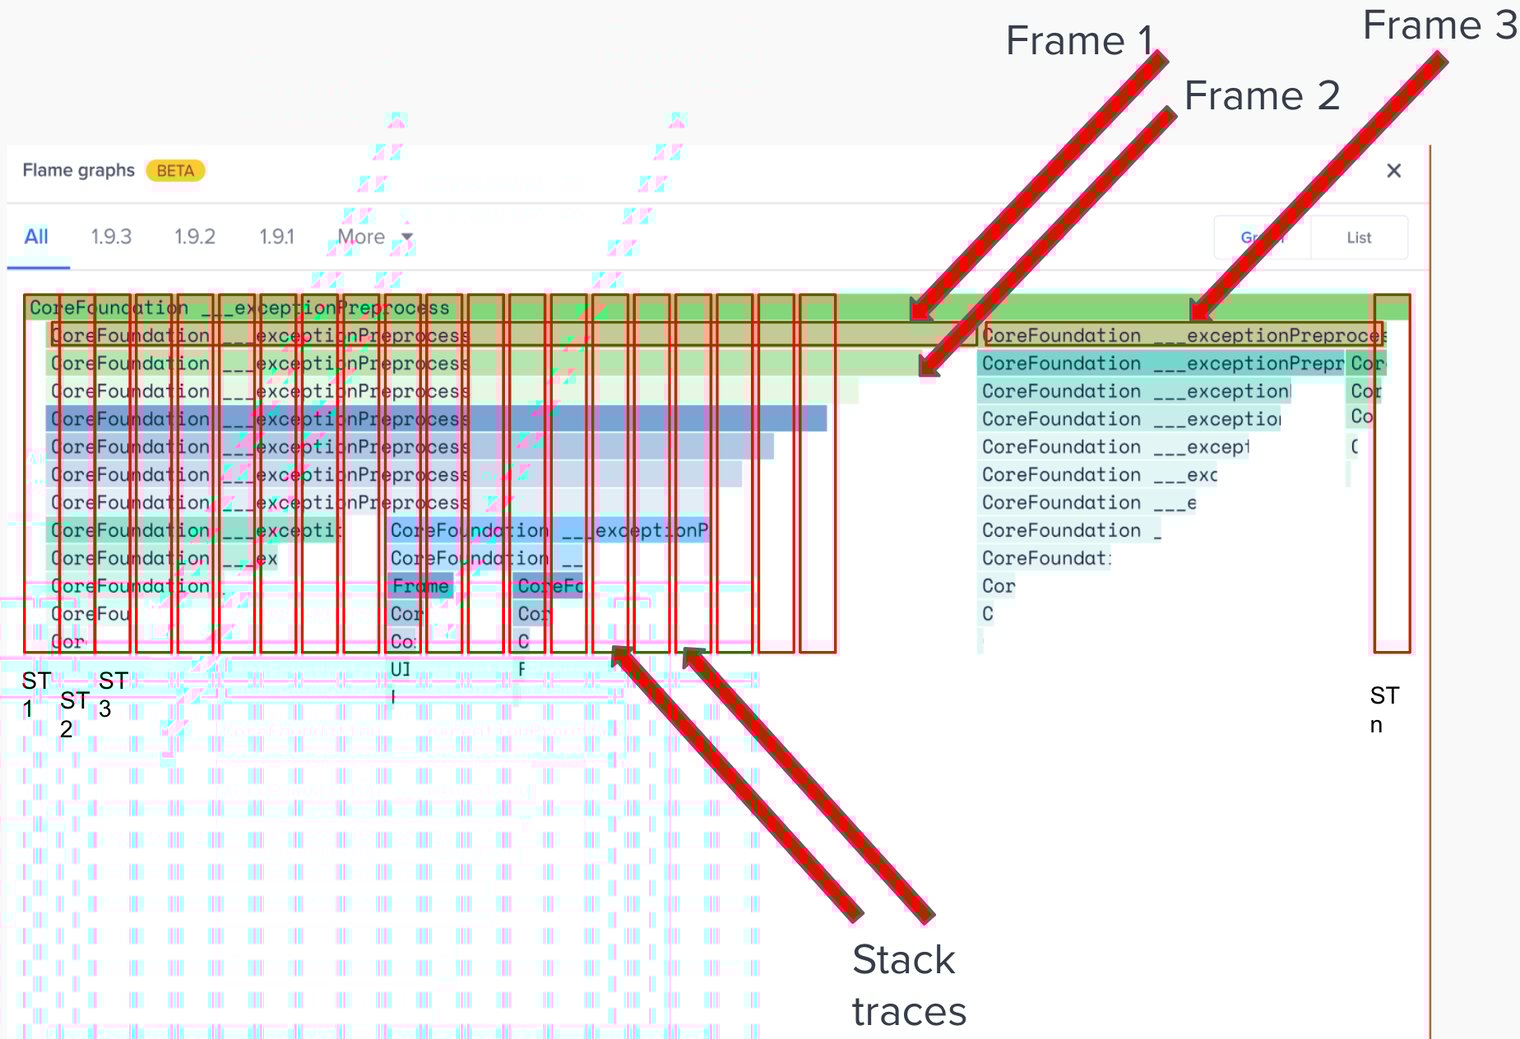
* There are 100 stack traces associated with the occurrences (1 stack trace per occurrence).
* The goal of the flame graphs is to combine those 100 occurrences.
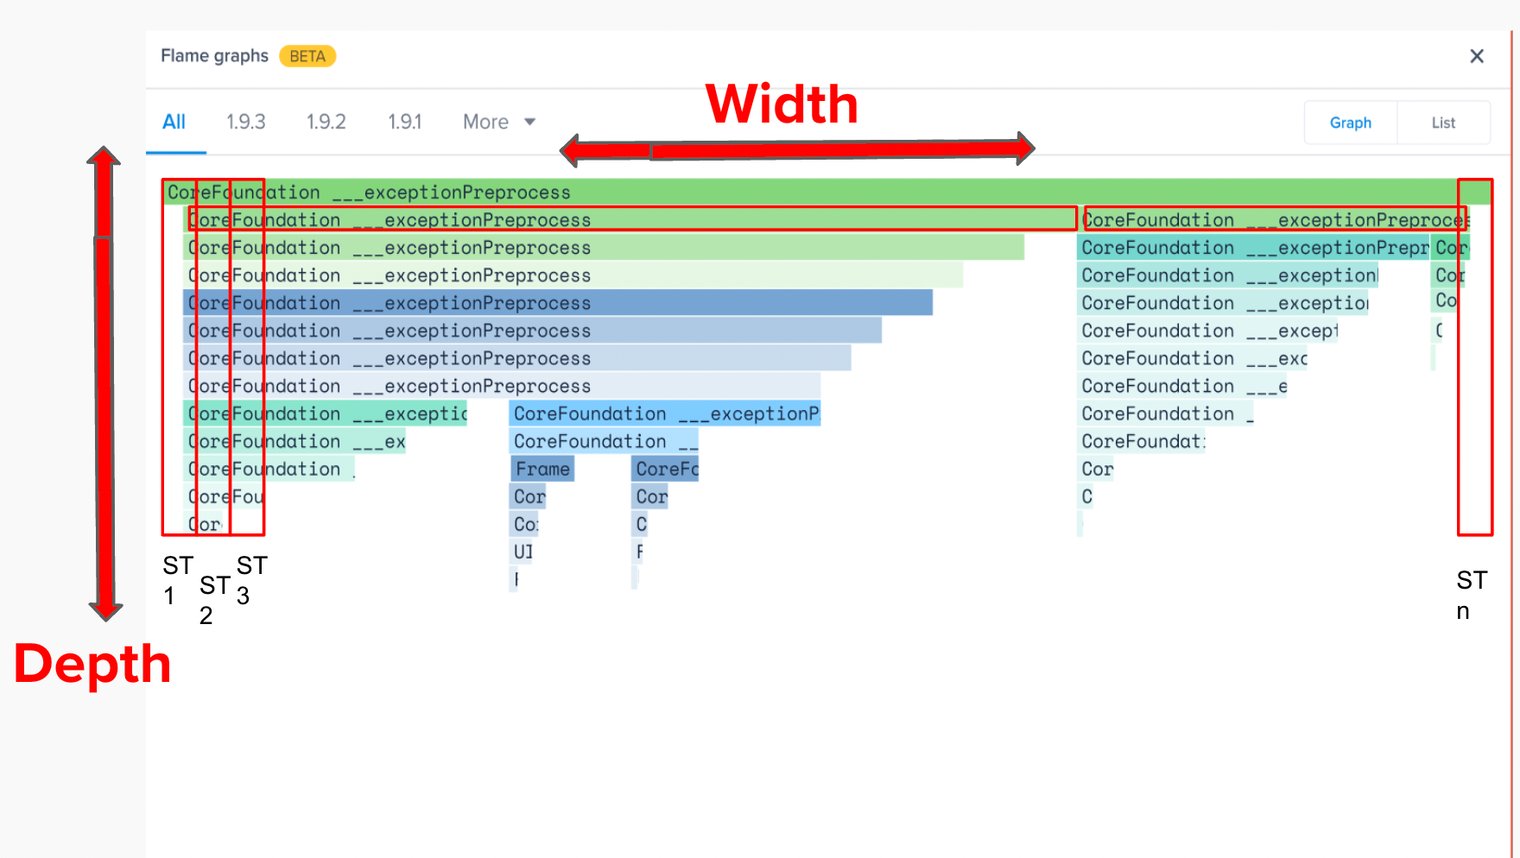
* The **width** of the bars for each frame would show the *frequency of the frame* to show up in the stack trace.
* The **depth** would show *the order* in which it appeared in the stack trace. (Refer to the below screenshot)
{% hint style="warning" %}
The width of the stack trace does not show the latency of the frame, but the frequency.This is what the flame graph looks like on the Luciq Dashboard
{% endhint %}
This is what the flame graph looks like on the Luciq Dashboard
---
# Agent Instructions
This documentation is published with GitBook. GitBook is the documentation platform designed so that both humans and AI agents can read, navigate, and reason over technical content effectively. Learn more at gitbook.com.
## Querying This Documentation
If you need additional information that is not directly available in this page, you can query the documentation dynamically by asking a question.
Perform an HTTP GET request on the current page URL with the `ask` query parameter, and the optional `goal` query parameter:
```
GET https://docs.luciq.ai/product-guides-and-integrations/product-guides/crash-reporting/flame-graphs.md?ask=&goal=
```
`ask` is the immediate question: it should be specific, self-contained, and written in natural language.
`goal` is optional and describes the broader end goal you are ultimately trying to accomplish on behalf of the user. GitBook uses it to tailor the answer towards what is most useful for that goal.
The response will contain a direct answer to the question and relevant excerpts and sources from the documentation.
Use this mechanism when the answer is not explicitly present in the current page, you need clarification or additional context, or you want to retrieve related documentation sections.