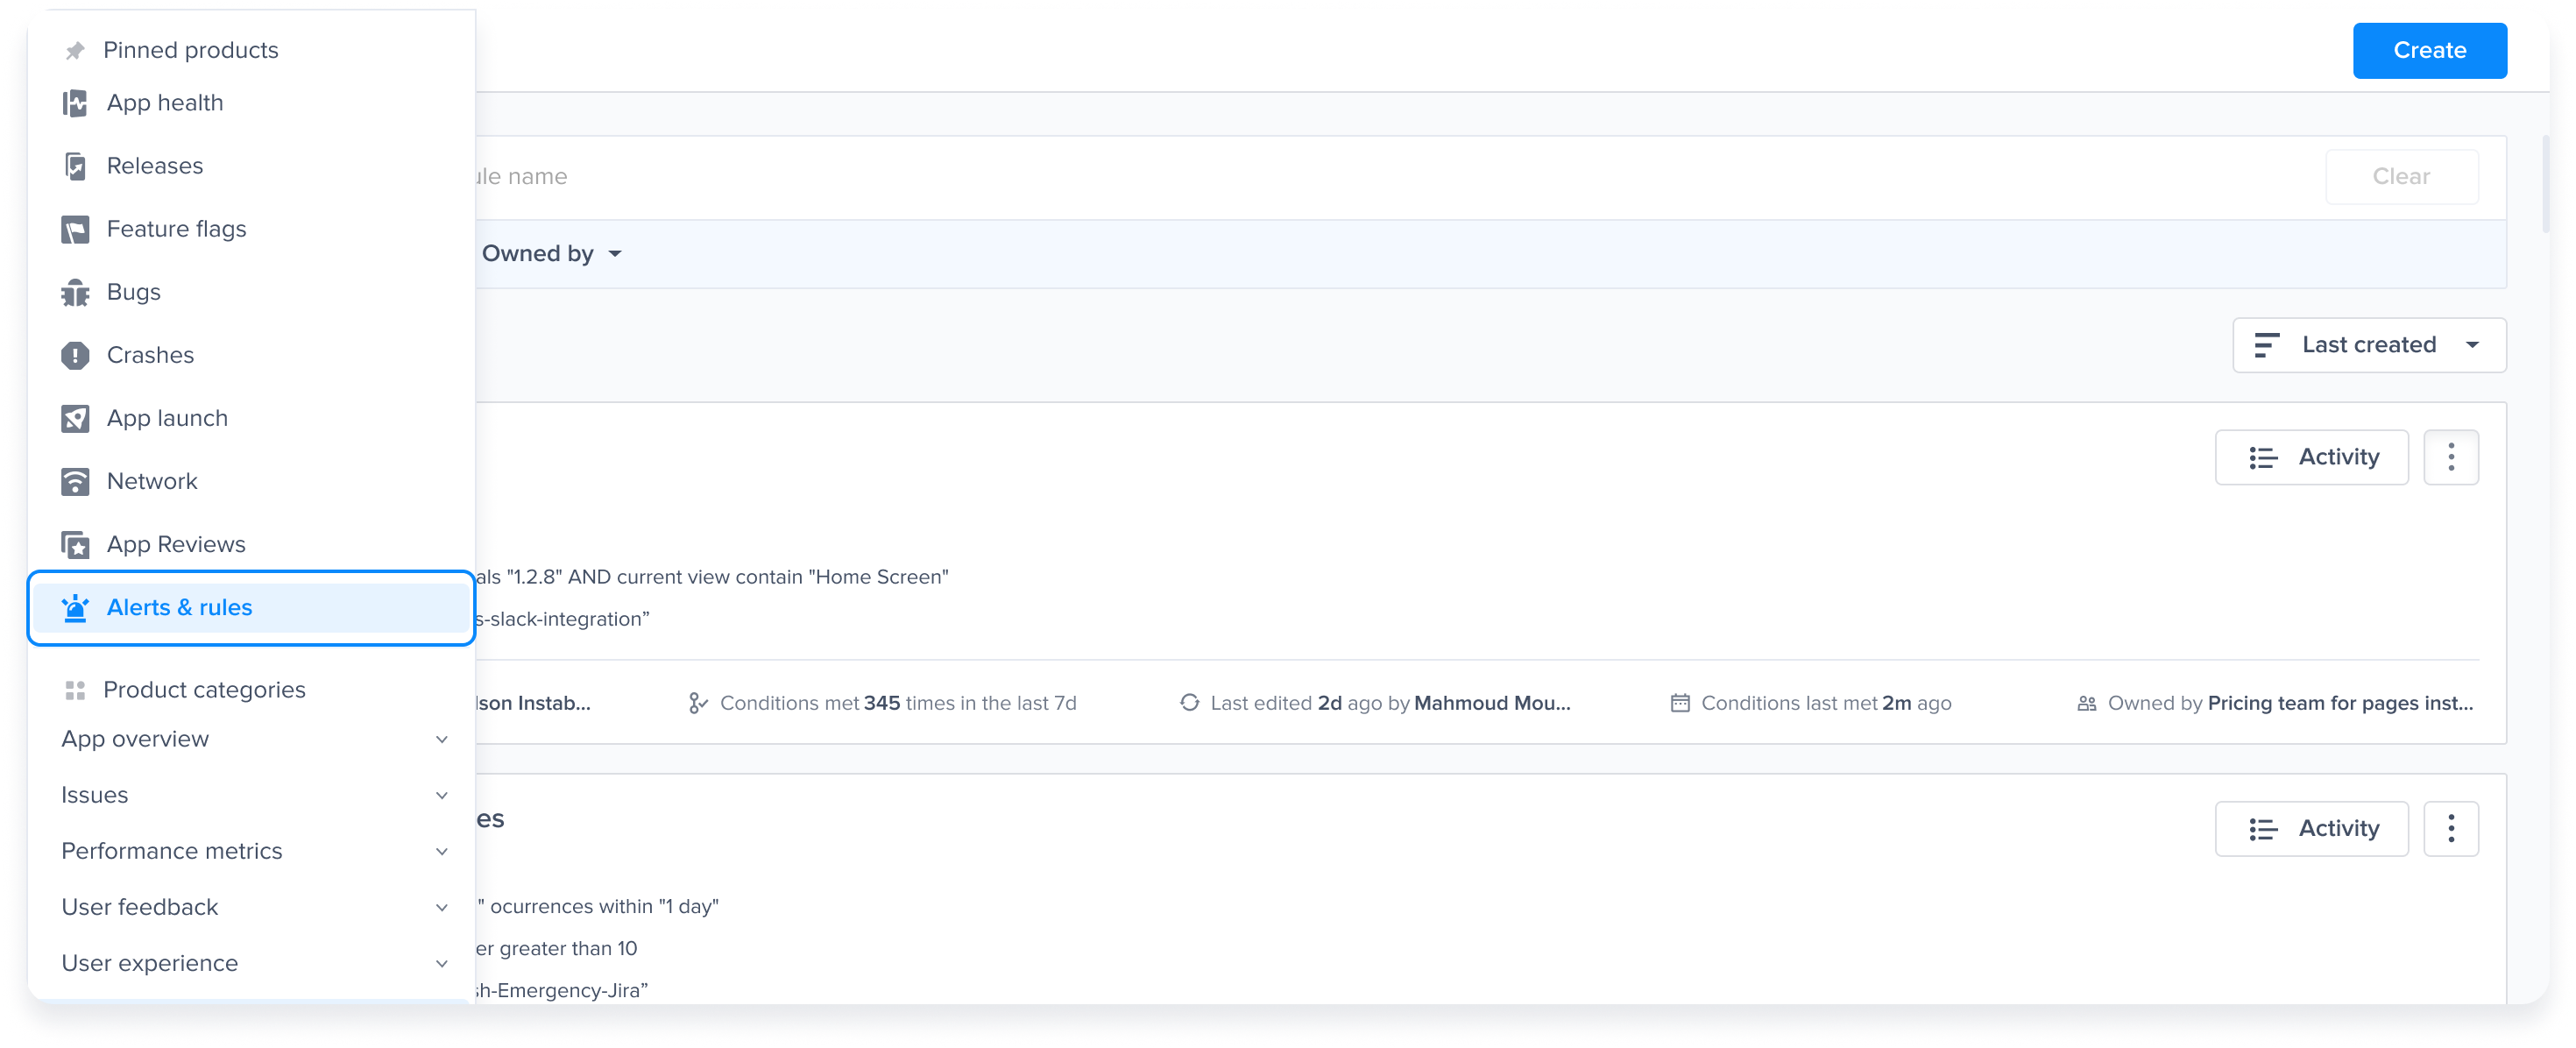
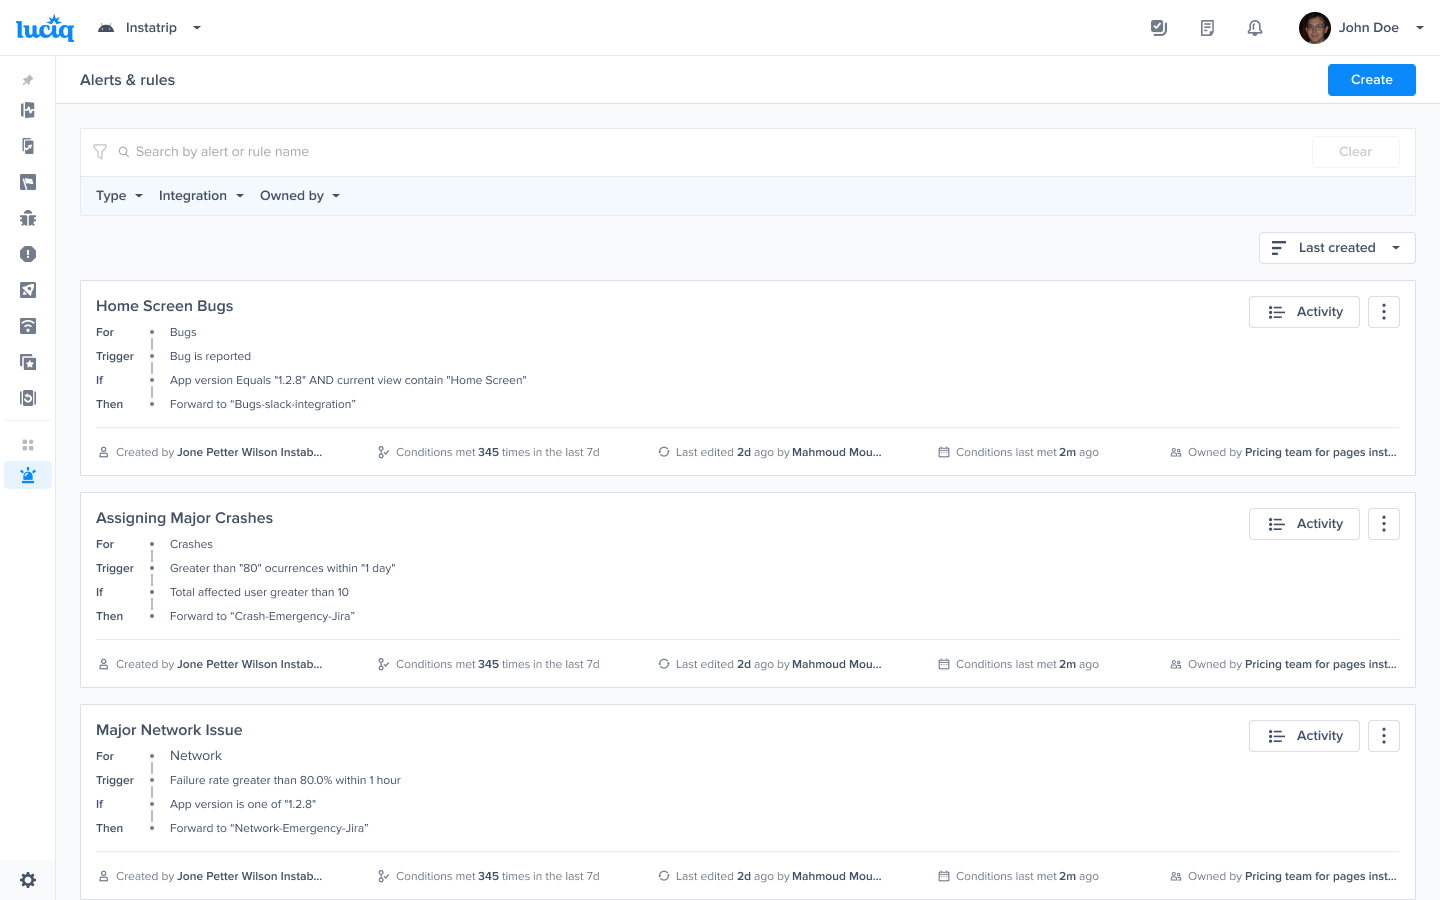
Alerts and rules from the Luciq menu
Alerts and rules from the Luciq menu
Click on "Create"
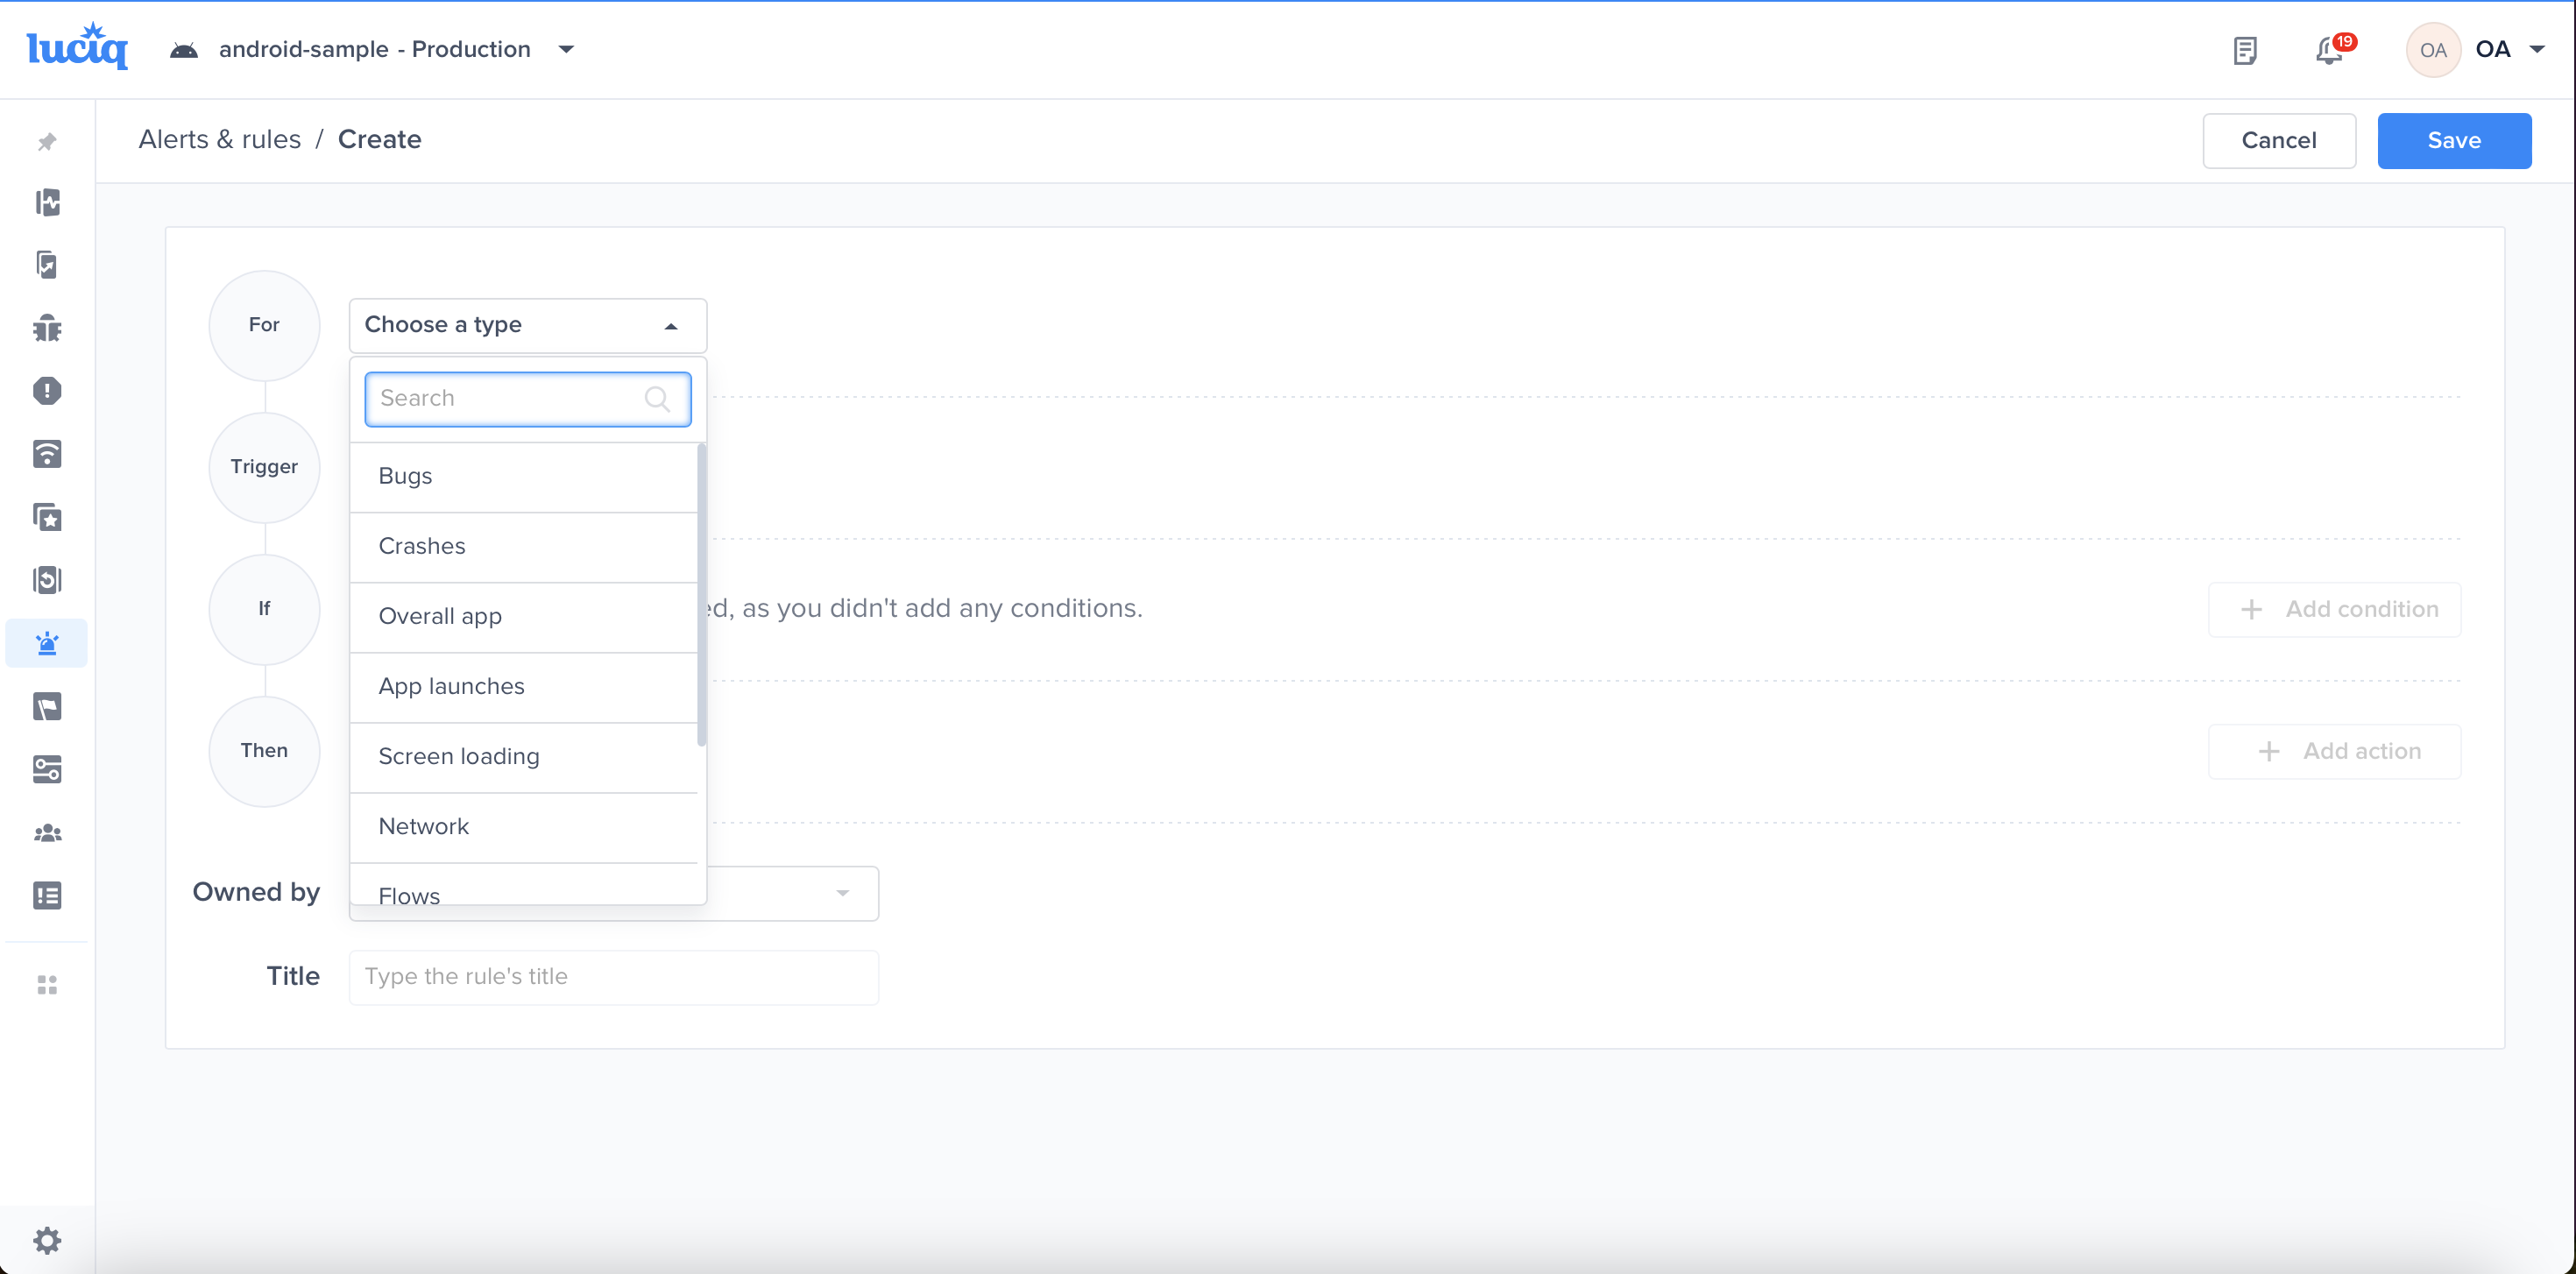
Choose the relevant performance metric for which you want to be alerted
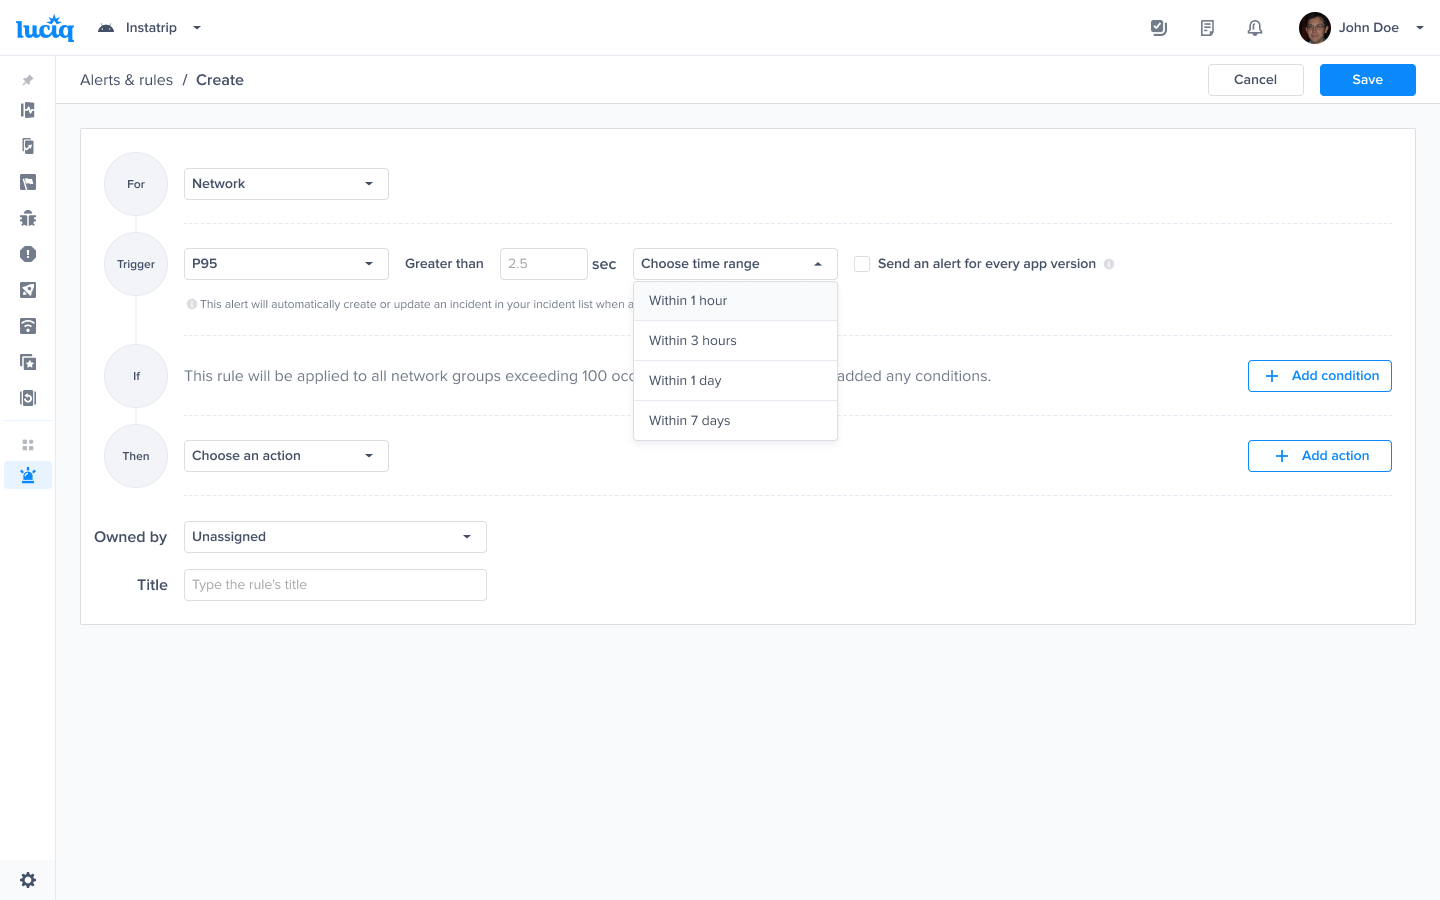
Choose the trigger and time range - Example P95
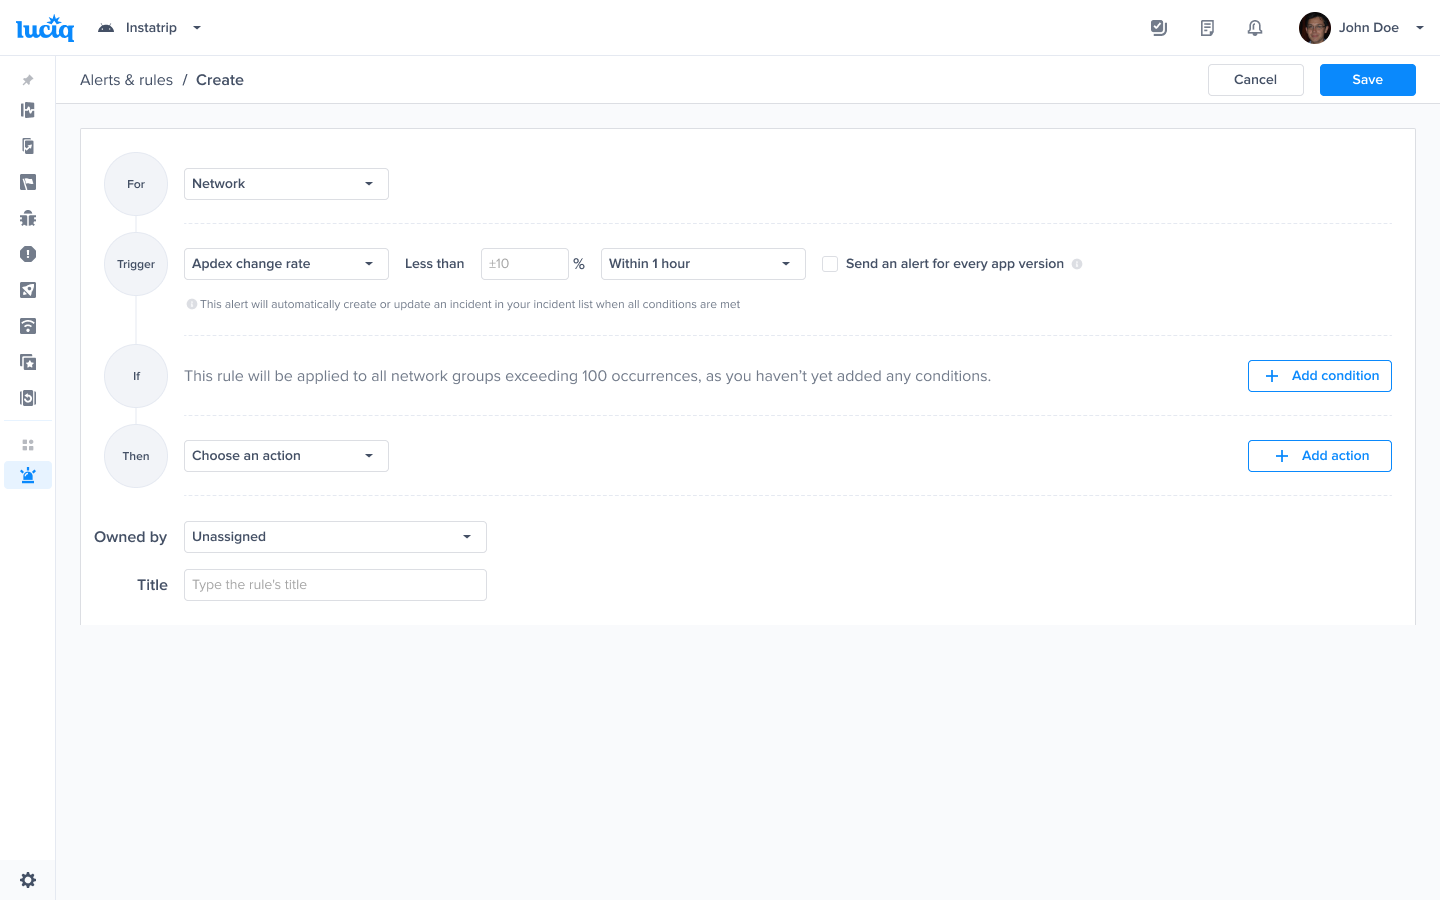
Choose the trigger and time range - Example Apdex change rate and time range
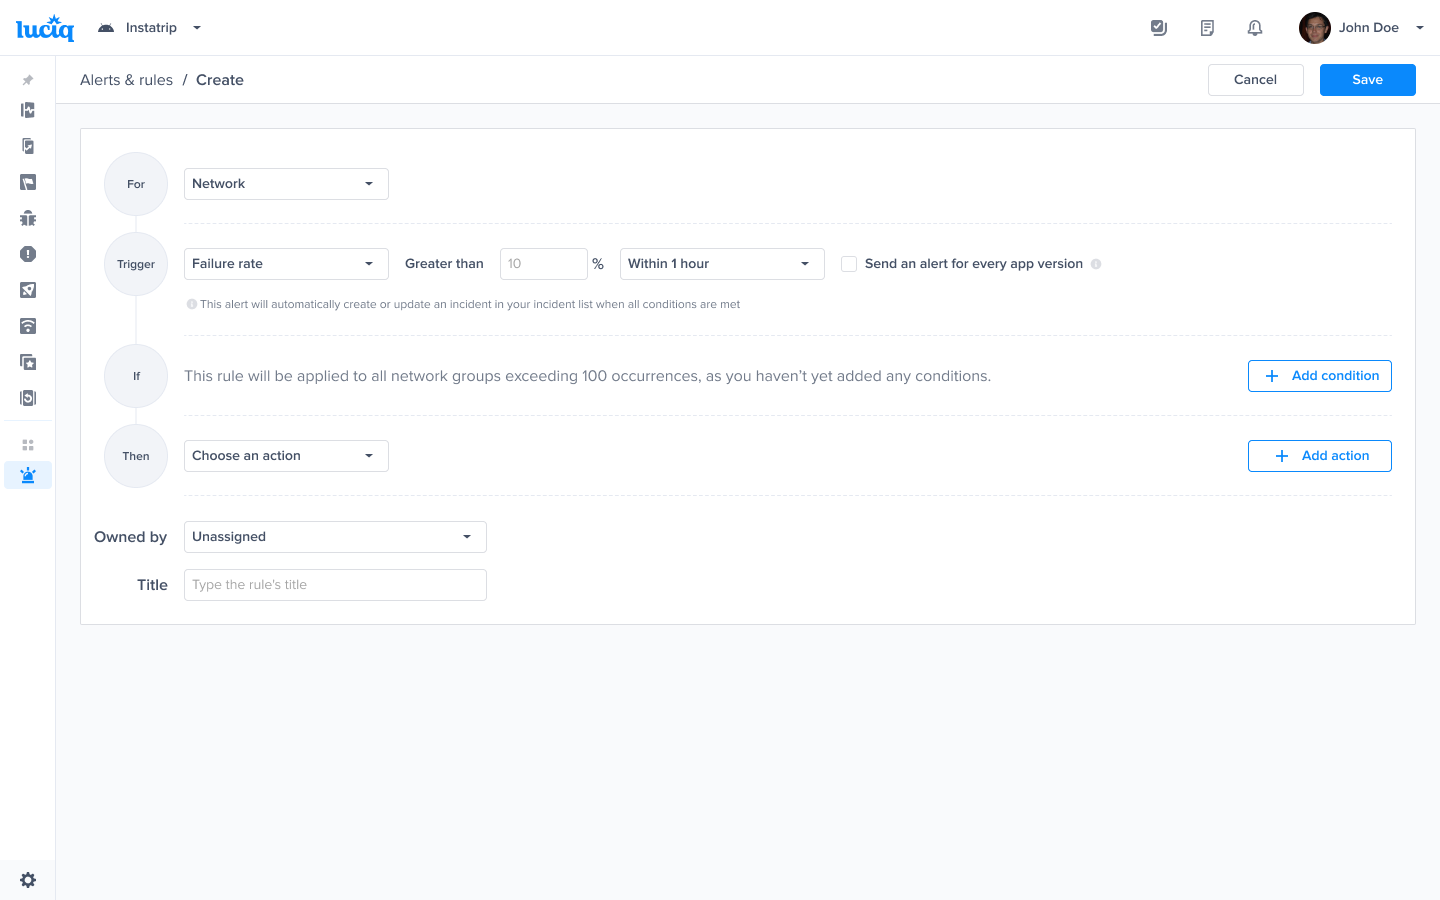
Choose the trigger and time range - Example Failure rate and time range
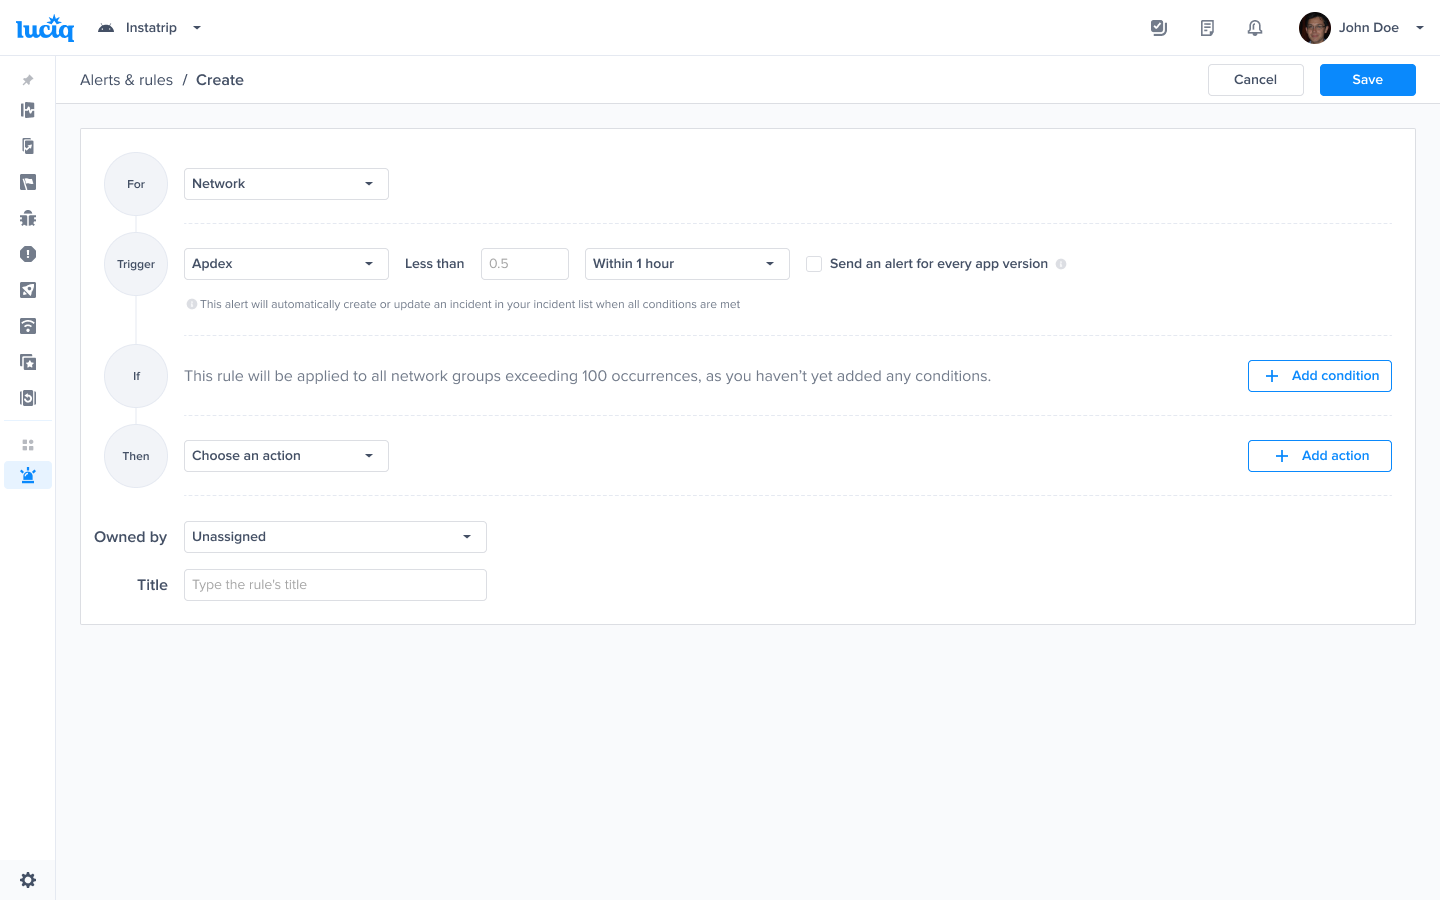
Choose the trigger and time range - Example Apdex and time range
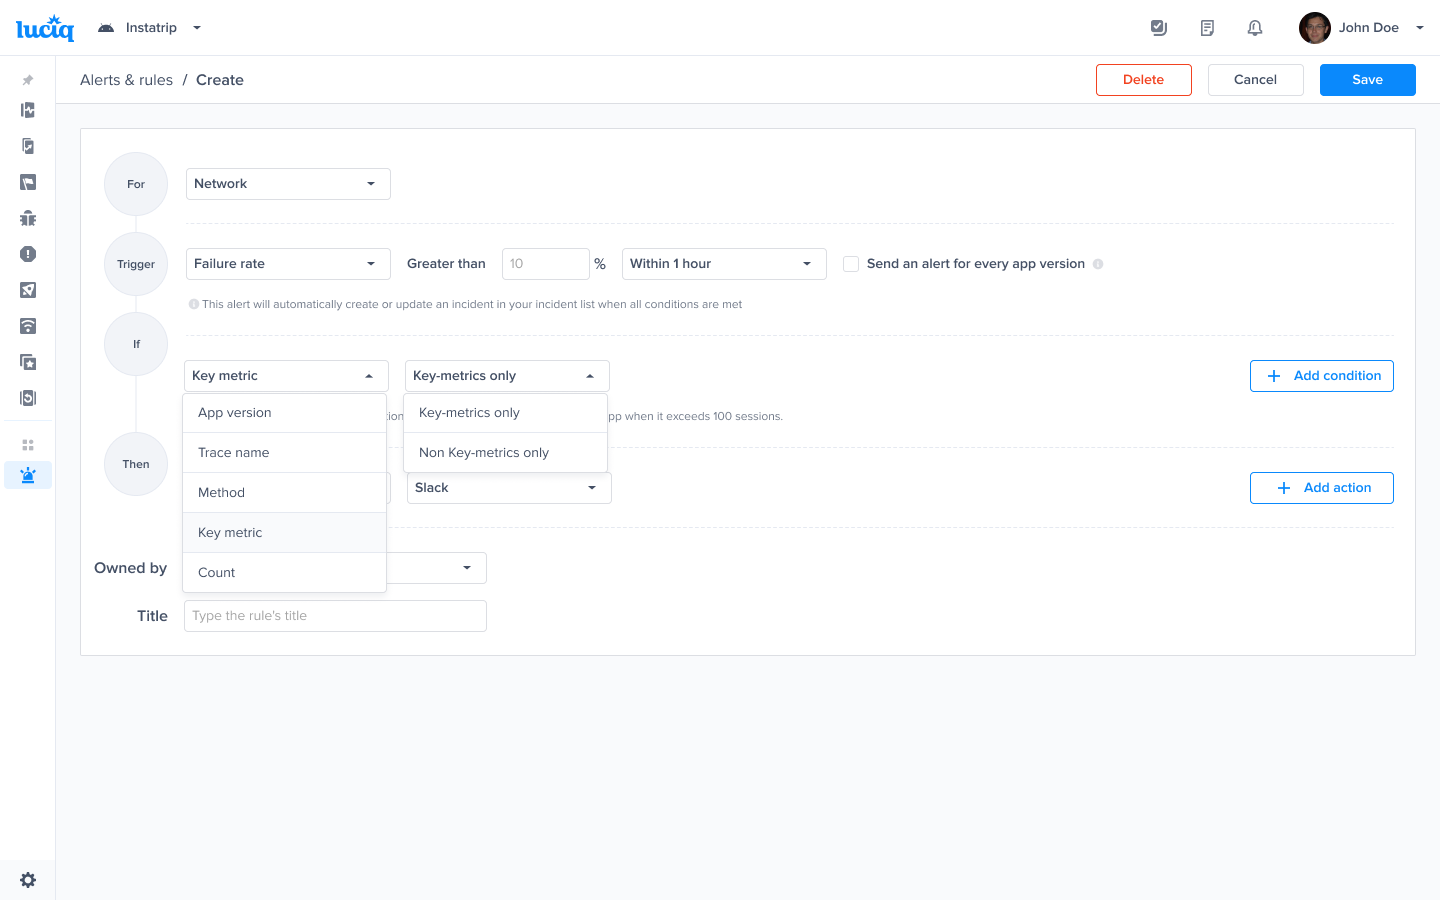
Choose the condition that should be checked to get alerted
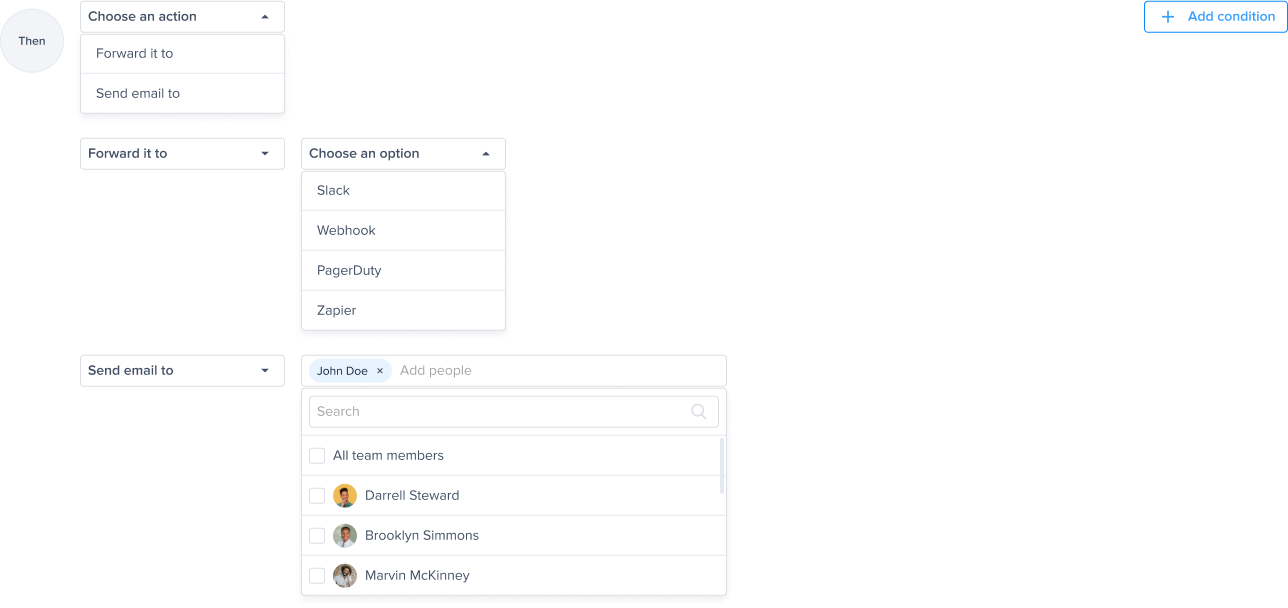
Forward your alert to slack

Optional - Choose the team that is responsible for this alert. And click "Save"
Triggers, conditions and Actions