> For the complete documentation index, see [llms.txt](https://docs.luciq.ai/llms.txt). Markdown versions of documentation pages are available by appending `.md` to page URLs; this page is available as [Markdown](https://docs.luciq.ai/product-guides-and-integrations/integrations/grafana/grafana-end-to-end-tracing.md).
# Grafana End to End Tracing
Link Luciq with Grafana for end-to-end tracing of network calls, joining client and server monitoring through W3C trace context headers.
### Overview
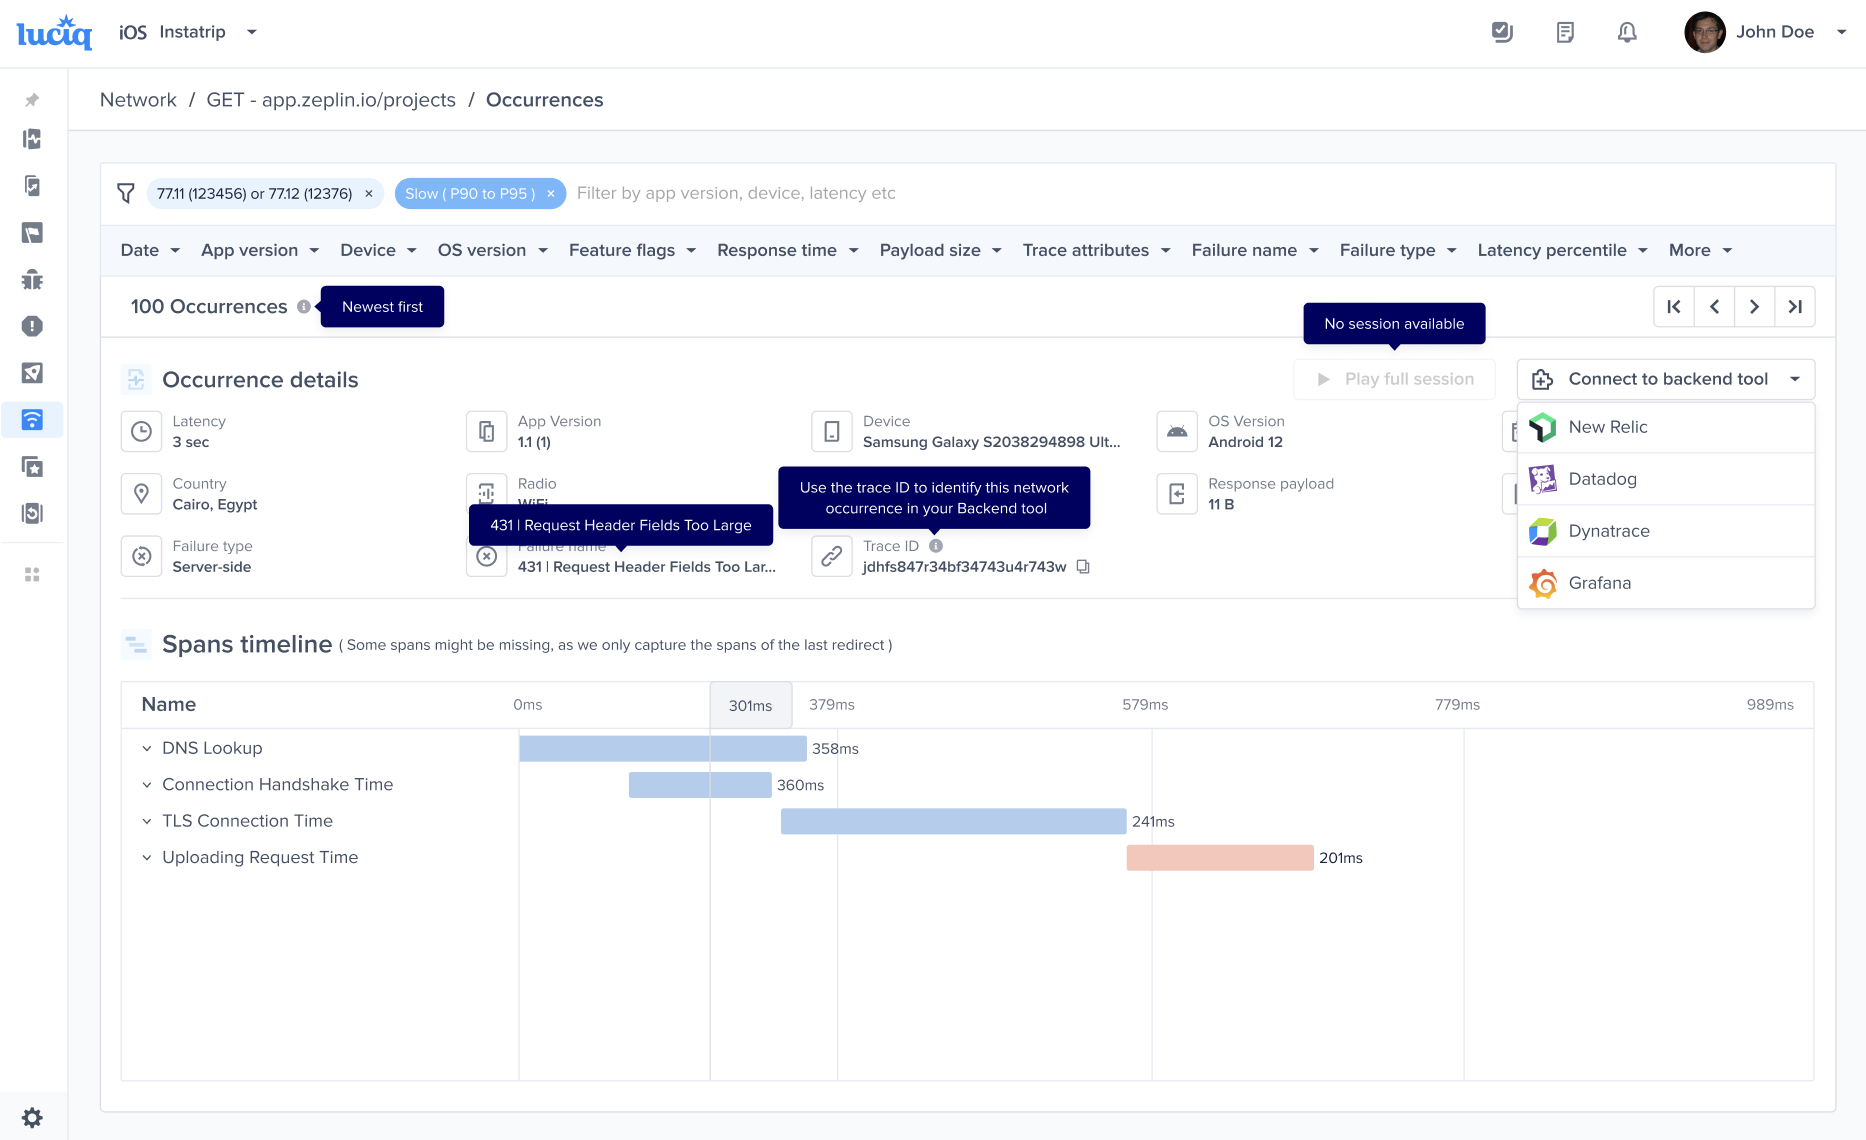
The new Luciq integration with Grafana enables end-to-end tracing for network calls, connecting client-side and server-side monitoring for your network requests. By using a unique trace ID, you can follow any network request from the client to the server, providing insights for troubleshooting networking issues.
### Prerequisites
* **Backend**
* **Agent Supporting W3C Context Propagation:** Ensure your backend agent supports W3C context propagation.
{% hint style="info" %}
**Note**
If you use any trace sampling algorithms, Grafana may drop some traces. Consequently, you might see network requests in Luciq that are not available in Grafana.
{% endhint %}
* **Luciq's Side**
* **Supported Platforms**: This integration is only supported for iOS and Android.
* **Luciq SDK Version**: Ensure you have Luciq SDK version 13.2.0 or higher for both iOS and Android.
* If you are manually logging the network they need to:
* Either send the `httpUrlConnection` or make sure you send all headers in the request
* If you are masking the headers, make sure you don't remove the `traceparent` header
### Integration Steps
{% hint style="info" %}
By setting up this integration, Luciq will attach a trace ID as an HTTP header to your network requests. This allows us to link network requests from Luciq to Grafana.
{% endhint %}
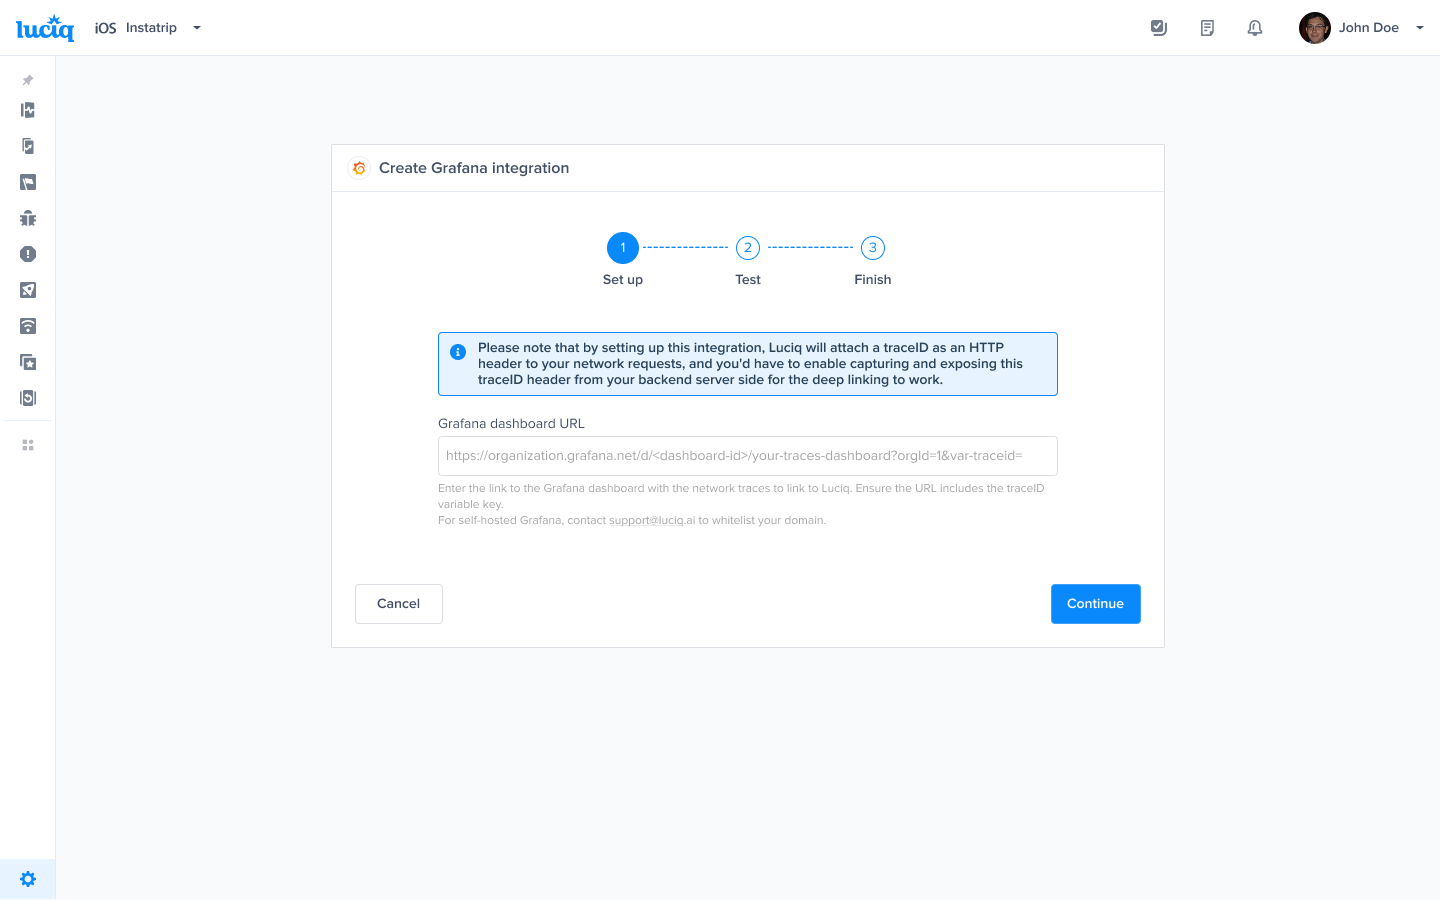
* To create a Grafana Integration go to Settings -> Integrations -> Grafana in your Luciq dashboard.
1. **Setup**
* Enter the link to **the Grafana dashboard with the network traces** to link to Luciq.
* Create a `traceID` variable in that Grafana dashboard, and **ensure the URL includes the** `traceID` **variable key at the end**.
* For example:\
`https://organization.grafana.net/d//your-traces-dashboard?orgId=1&var-traceid=`
* For self-hosted Grafana, contact to whitelist your domain.
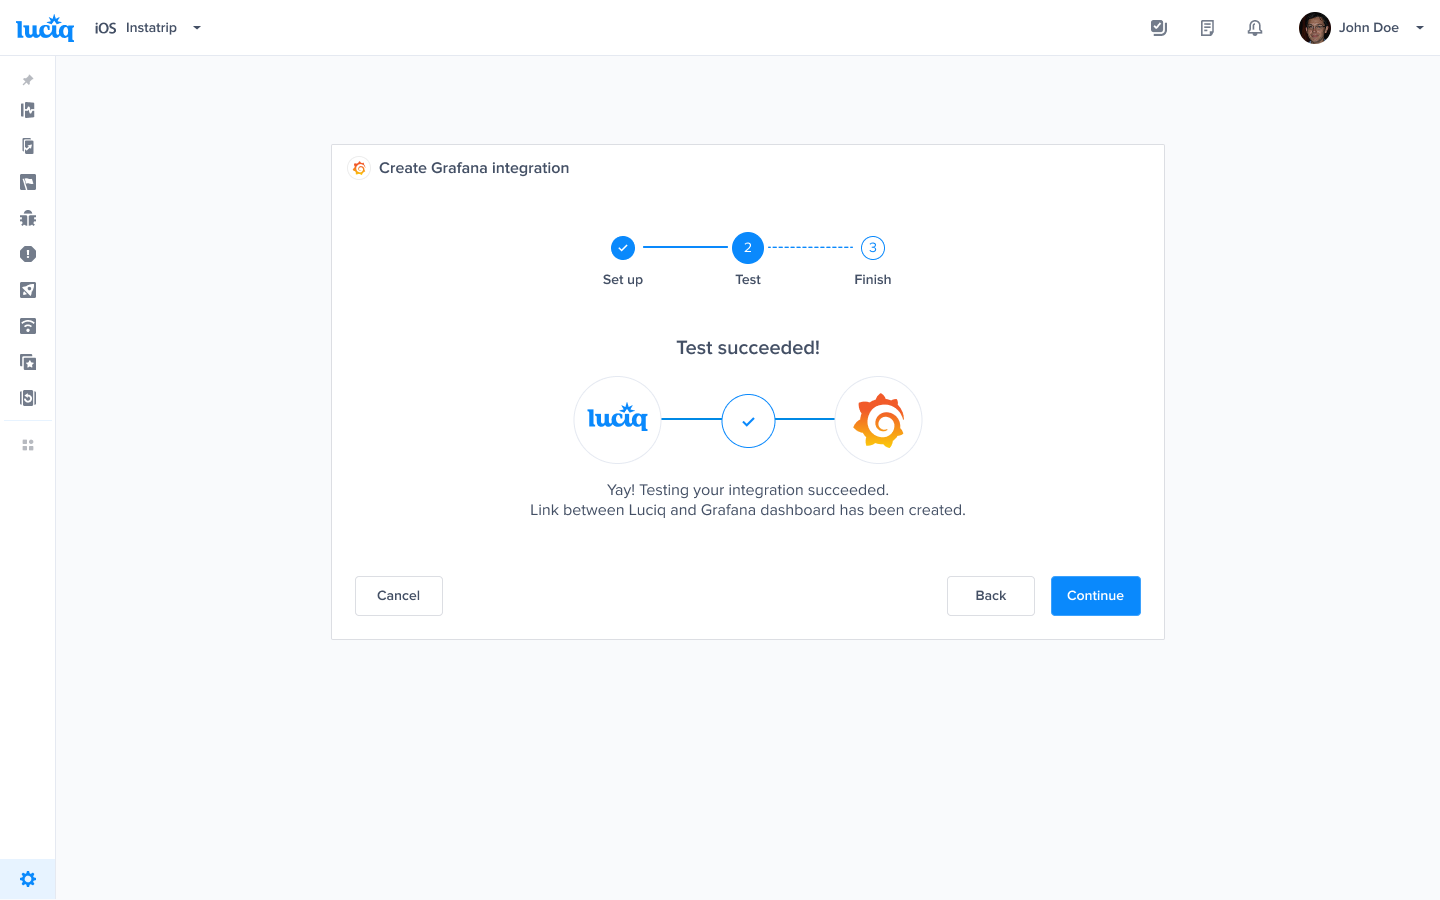
2. **Test**:
* Validate the Grafana dashboard link to ensure it is correct.
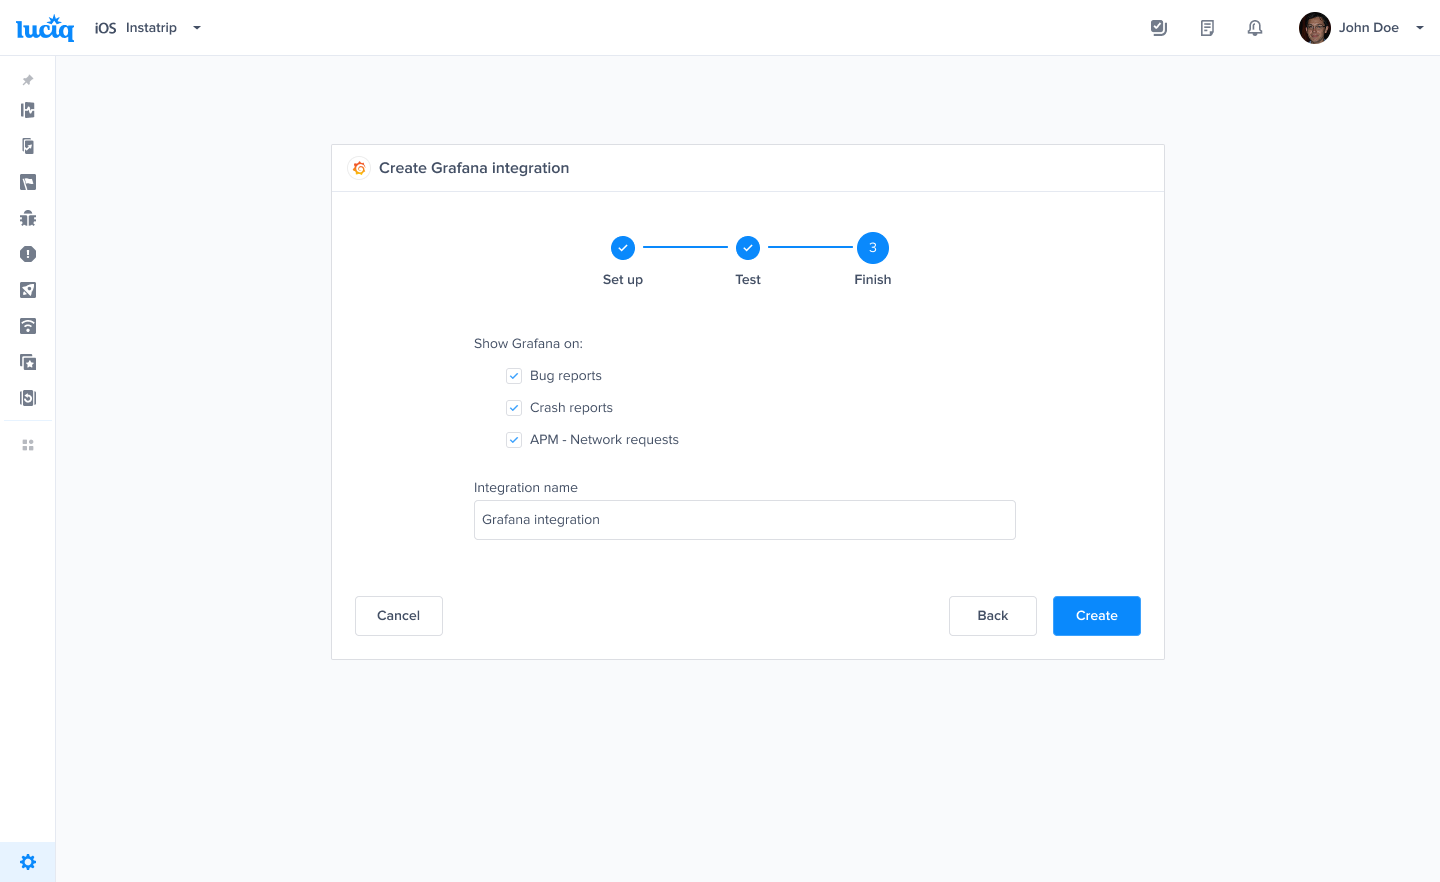
3. **Finish**:
* Ensure the APM - Network Requests checkbox is checked to trace network requests to Grafana.
* Give your integration a name and save the integration.
### Using the Integration
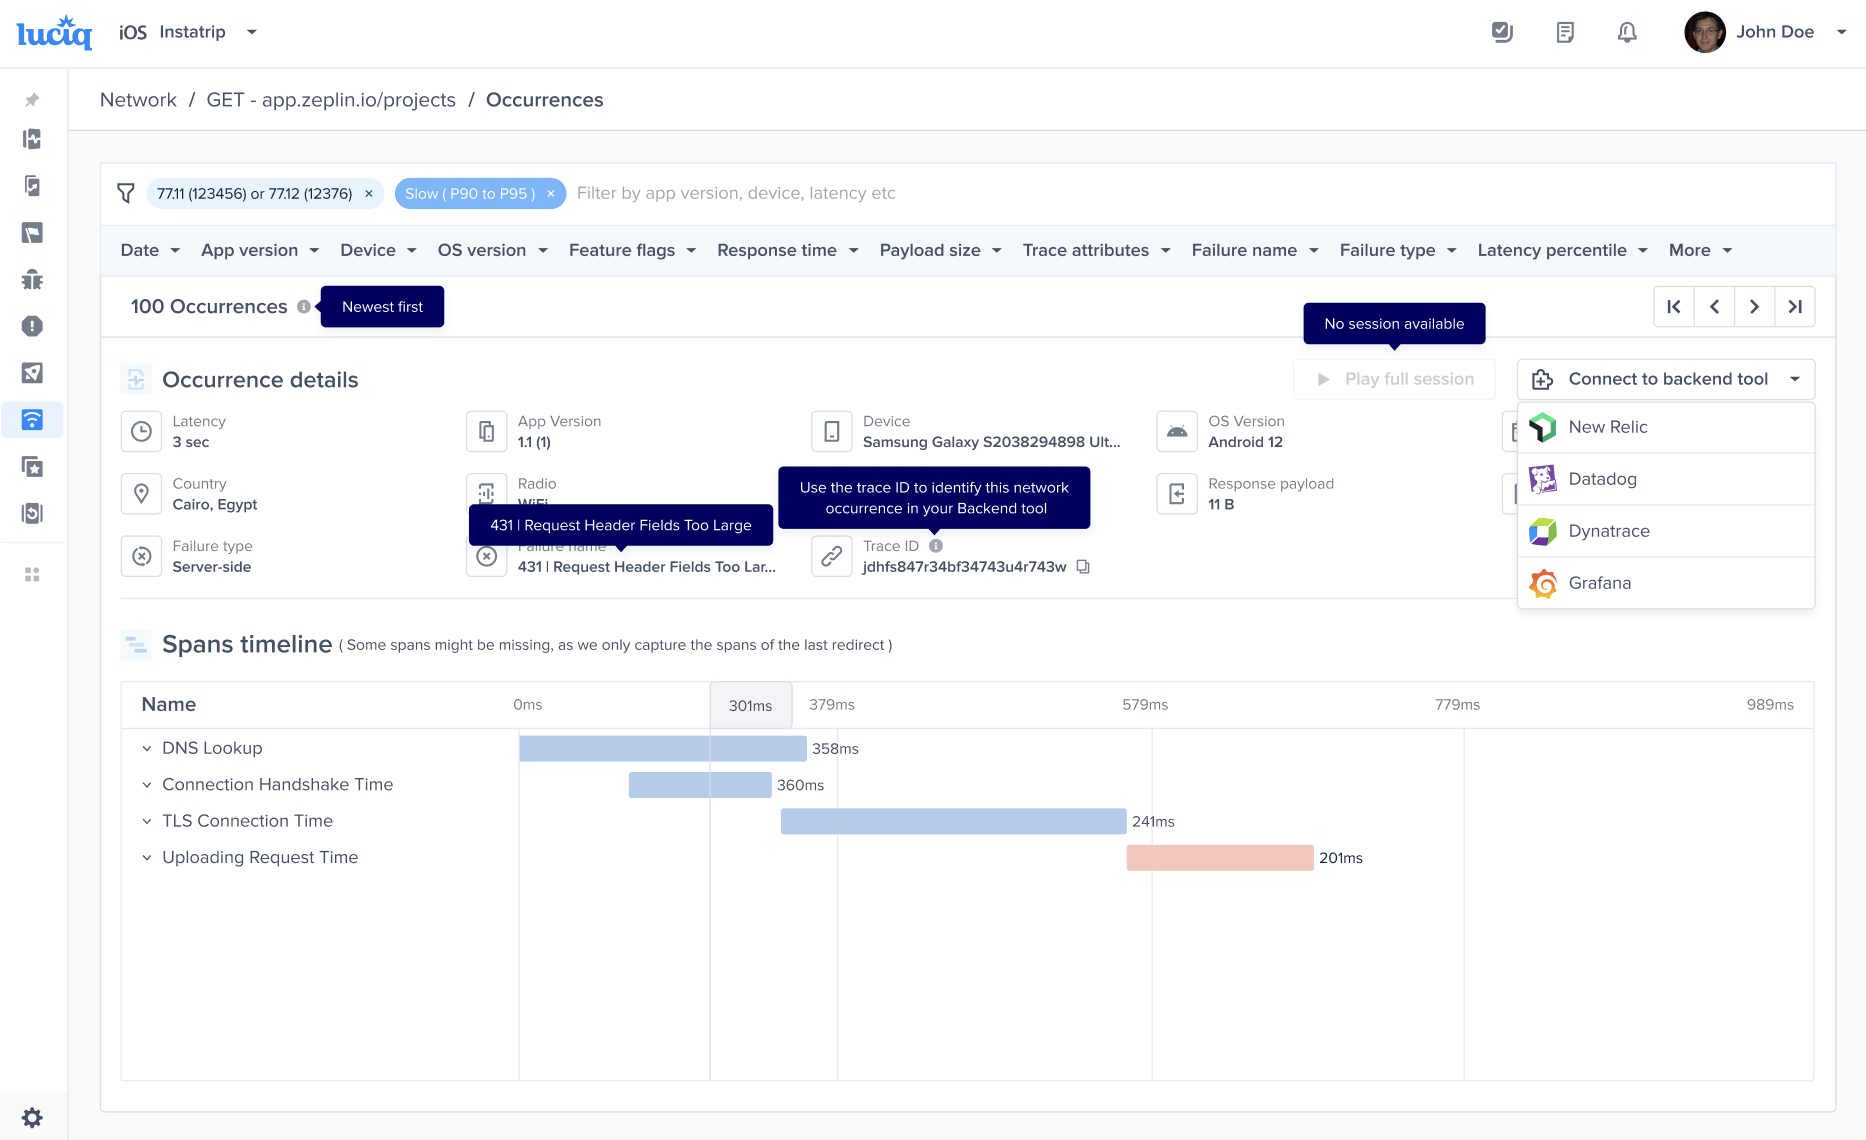
When a network occurrence is logged, a unique trace ID will appear on the occurrence page in the Luciq dashboard.
1. Navigate to a network occurrence in Luciq.
2. Click on **View on Grafana** to verify that it redirects you to the correct Grafana dashboard, filtered by the `TraceID`.
---
# Agent Instructions
This documentation is published with GitBook. GitBook is the documentation platform designed so that both humans and AI agents can read, navigate, and reason over technical content effectively. Learn more at gitbook.com.
## Querying This Documentation
If you need additional information that is not directly available in this page, you can query the documentation dynamically by asking a question.
Perform an HTTP GET request on the current page URL with the `ask` query parameter, and the optional `goal` query parameter:
```
GET https://docs.luciq.ai/product-guides-and-integrations/integrations/grafana/grafana-end-to-end-tracing.md?ask=&goal=
```
`ask` is the immediate question: it should be specific, self-contained, and written in natural language.
`goal` is optional and describes the broader end goal you are ultimately trying to accomplish on behalf of the user. GitBook uses it to tailor the answer towards what is most useful for that goal.
The response will contain a direct answer to the question and relevant excerpts and sources from the documentation.
Use this mechanism when the answer is not explicitly present in the current page, you need clarification or additional context, or you want to retrieve related documentation sections.