| iOS | /files/IzfxgtTwfQmb91bbaTIu | Setup and Product Guides | https://docs.luciq.ai/ios |
| Android | /files/aYaC8KxPwj4rh5LsKjFA | https://docs.luciq.ai/android | |
| React Native | /files/3ubU12rtyQYsYwWmZ0iU | https://docs.luciq.ai/react-native | |
| Flutter | /files/HJlFcwrKyU1a7pOlbEHt | https://docs.luciq.ai/flutter | |
| API Reference | https://docs.luciq.ai/references |
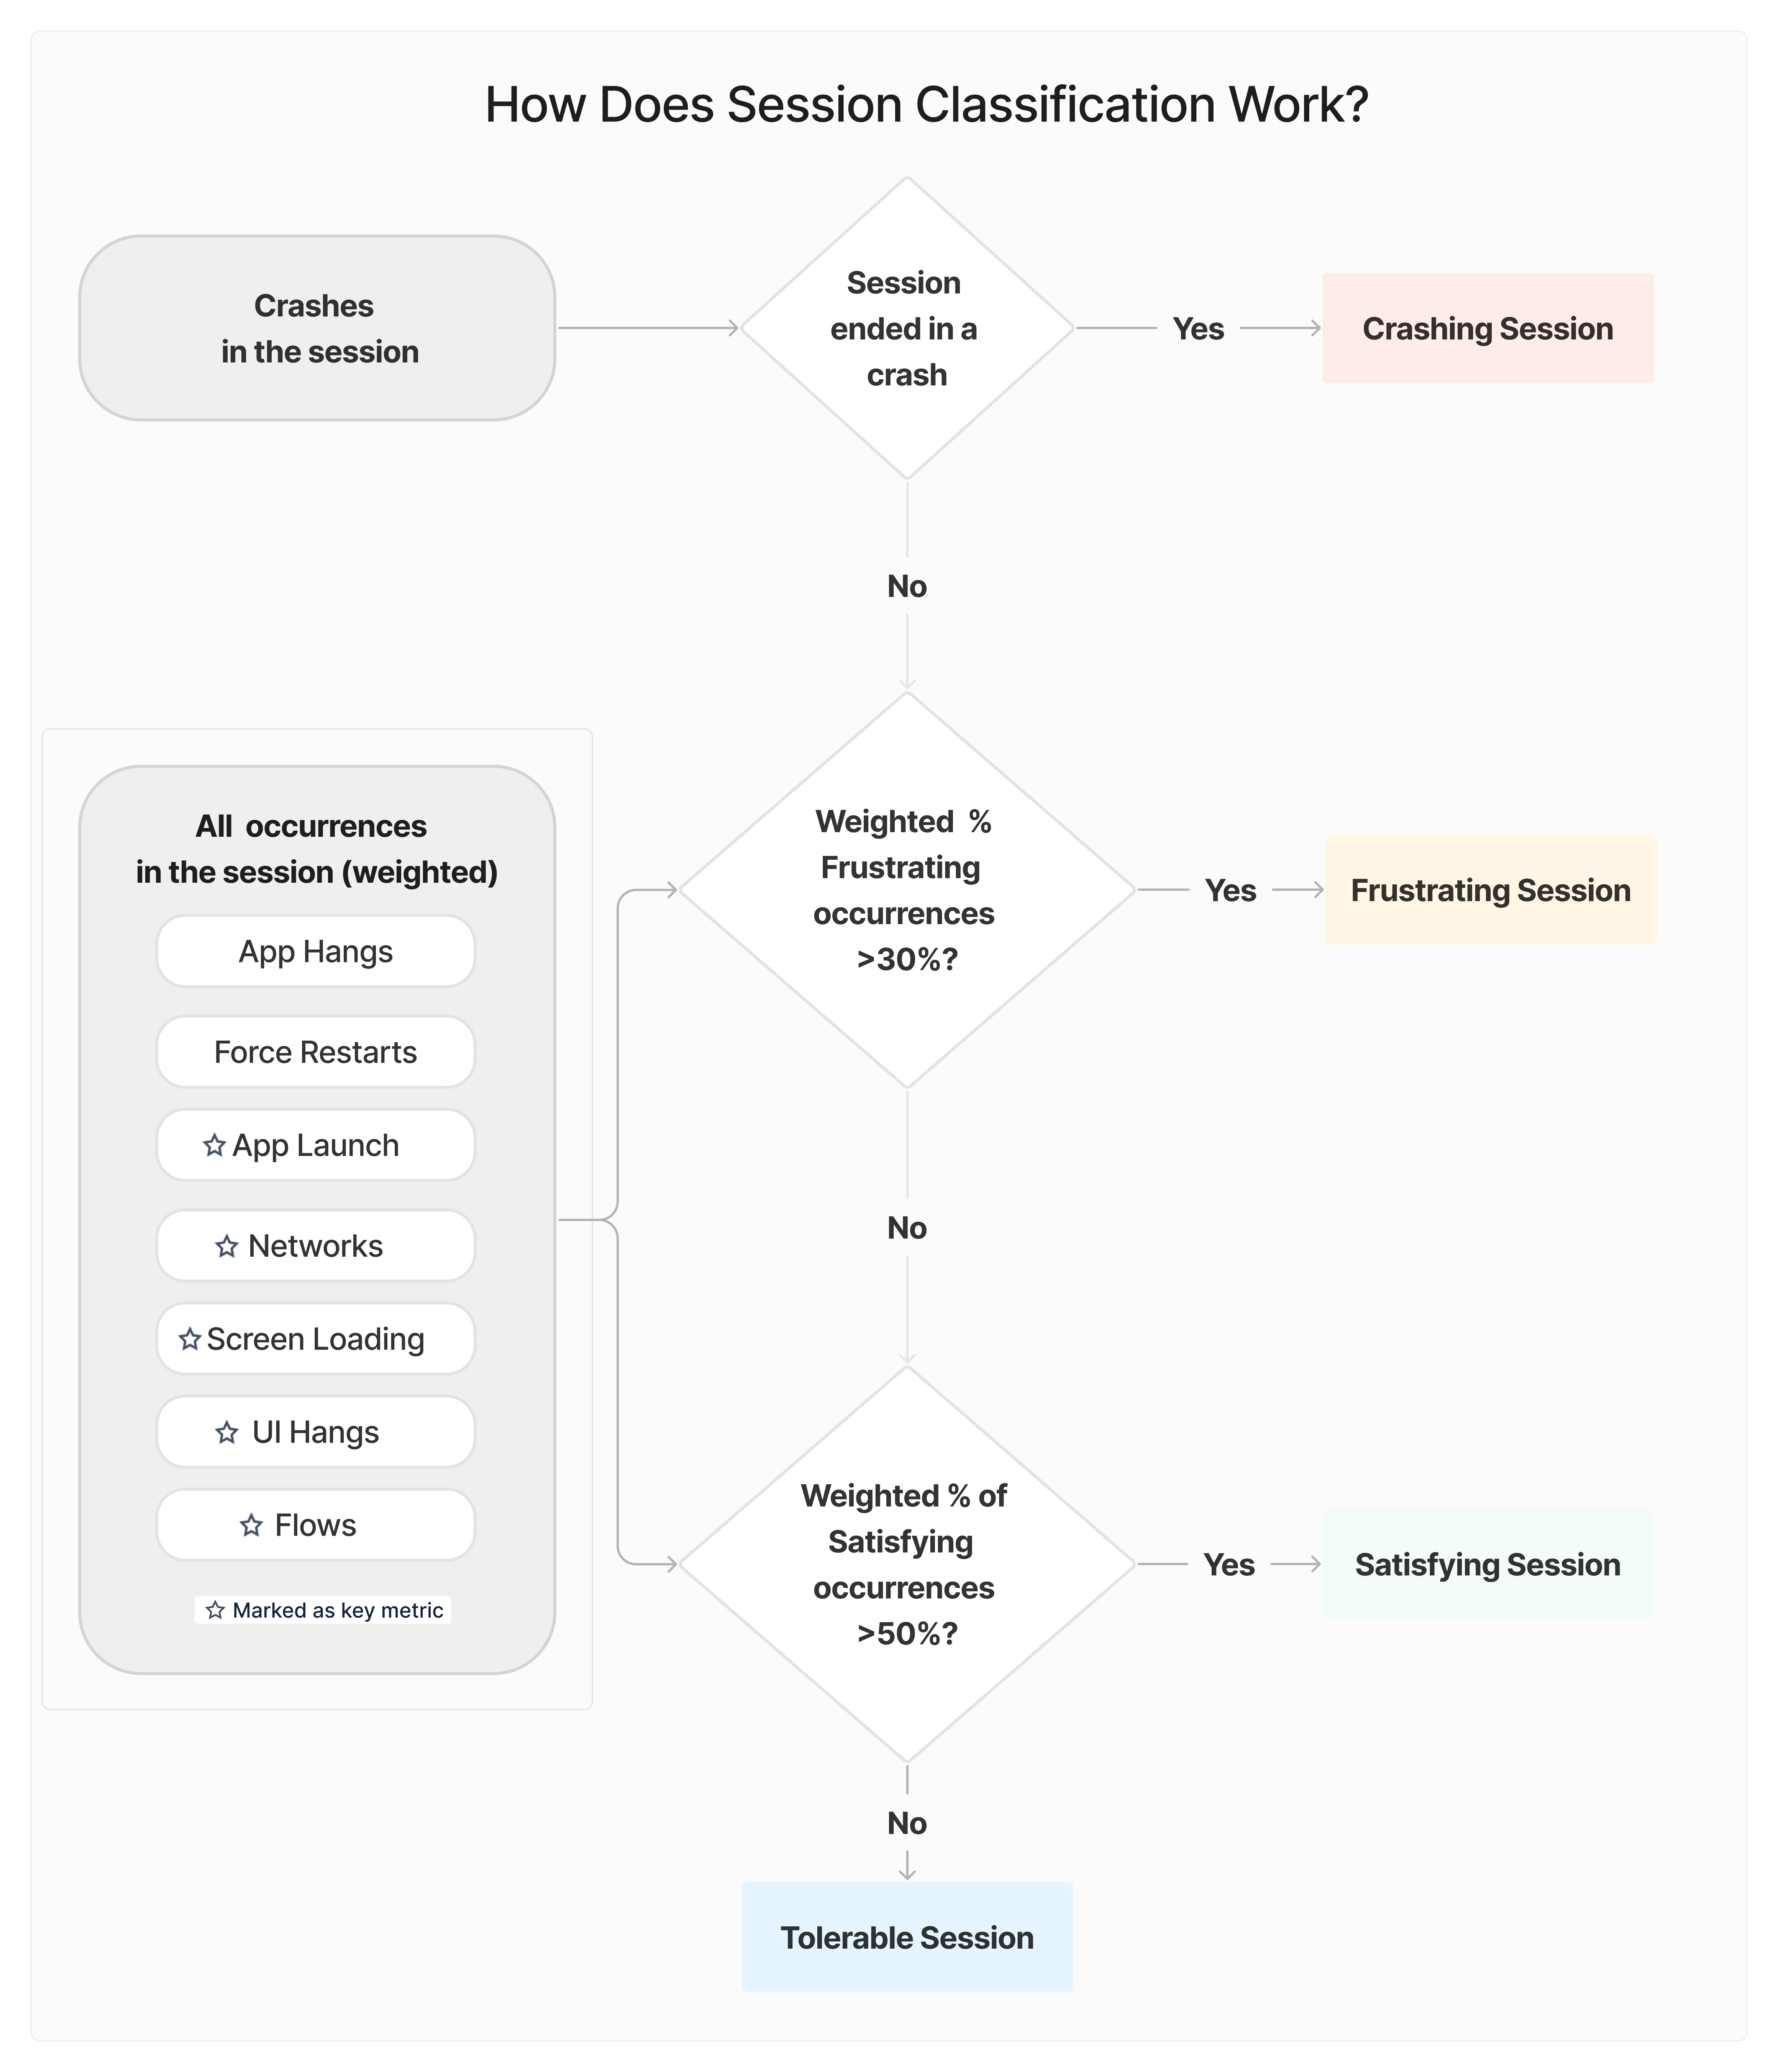
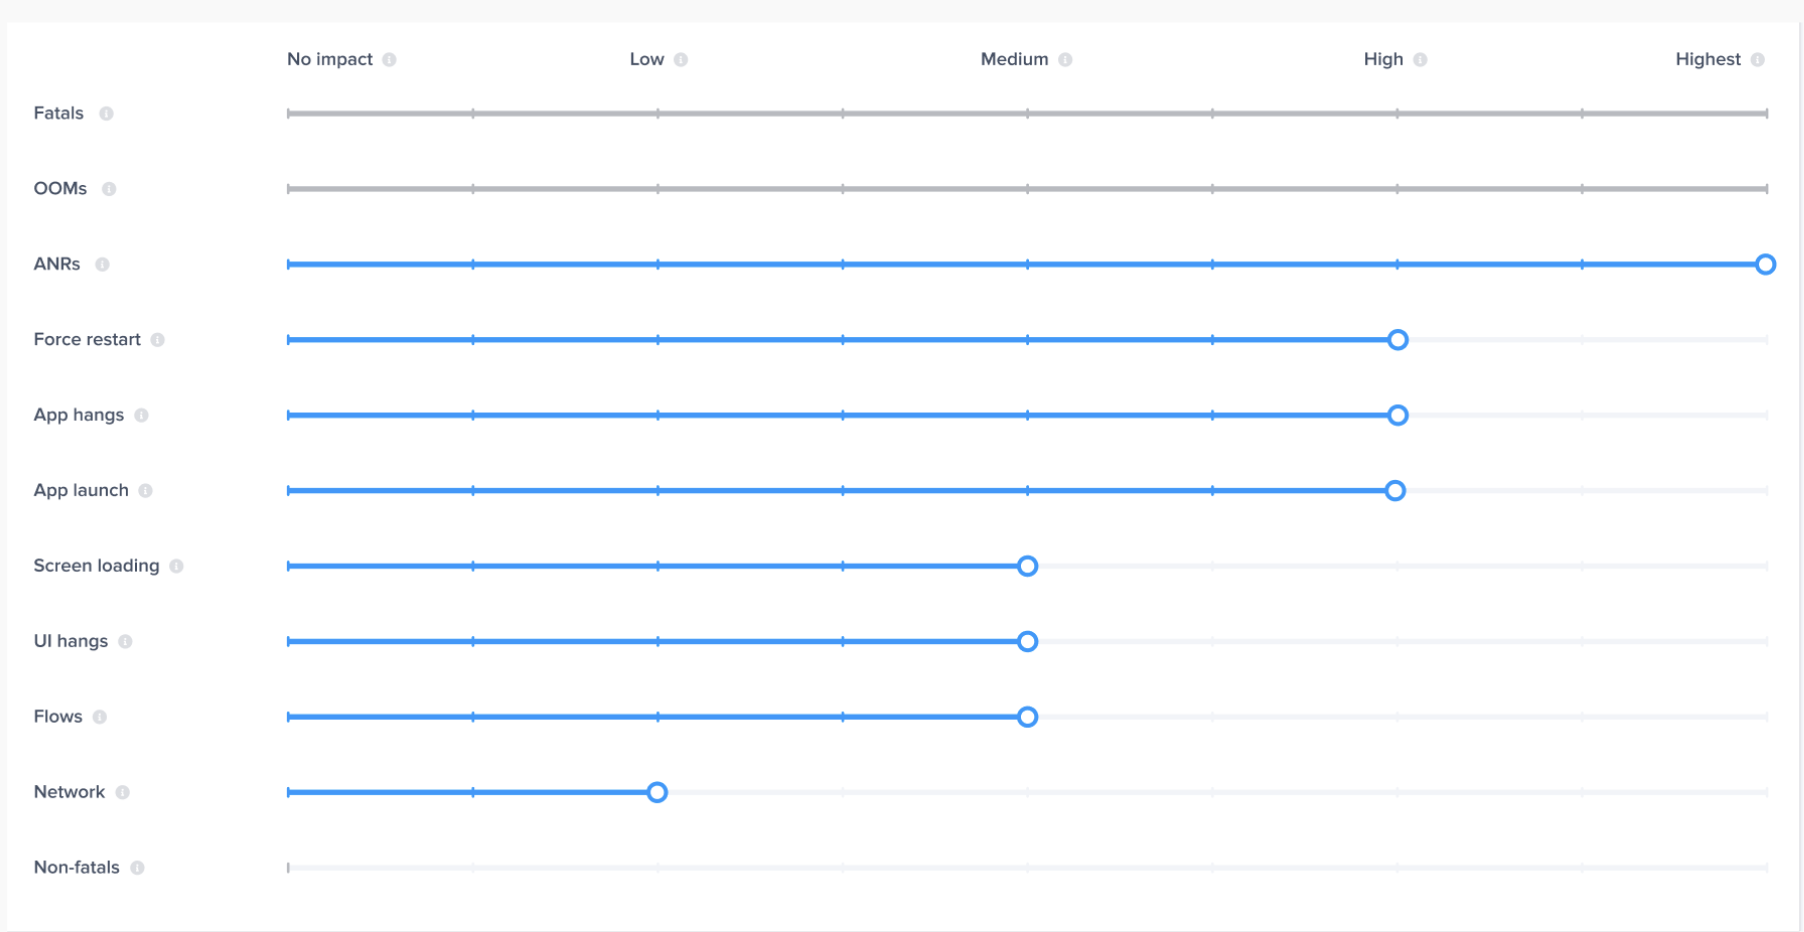
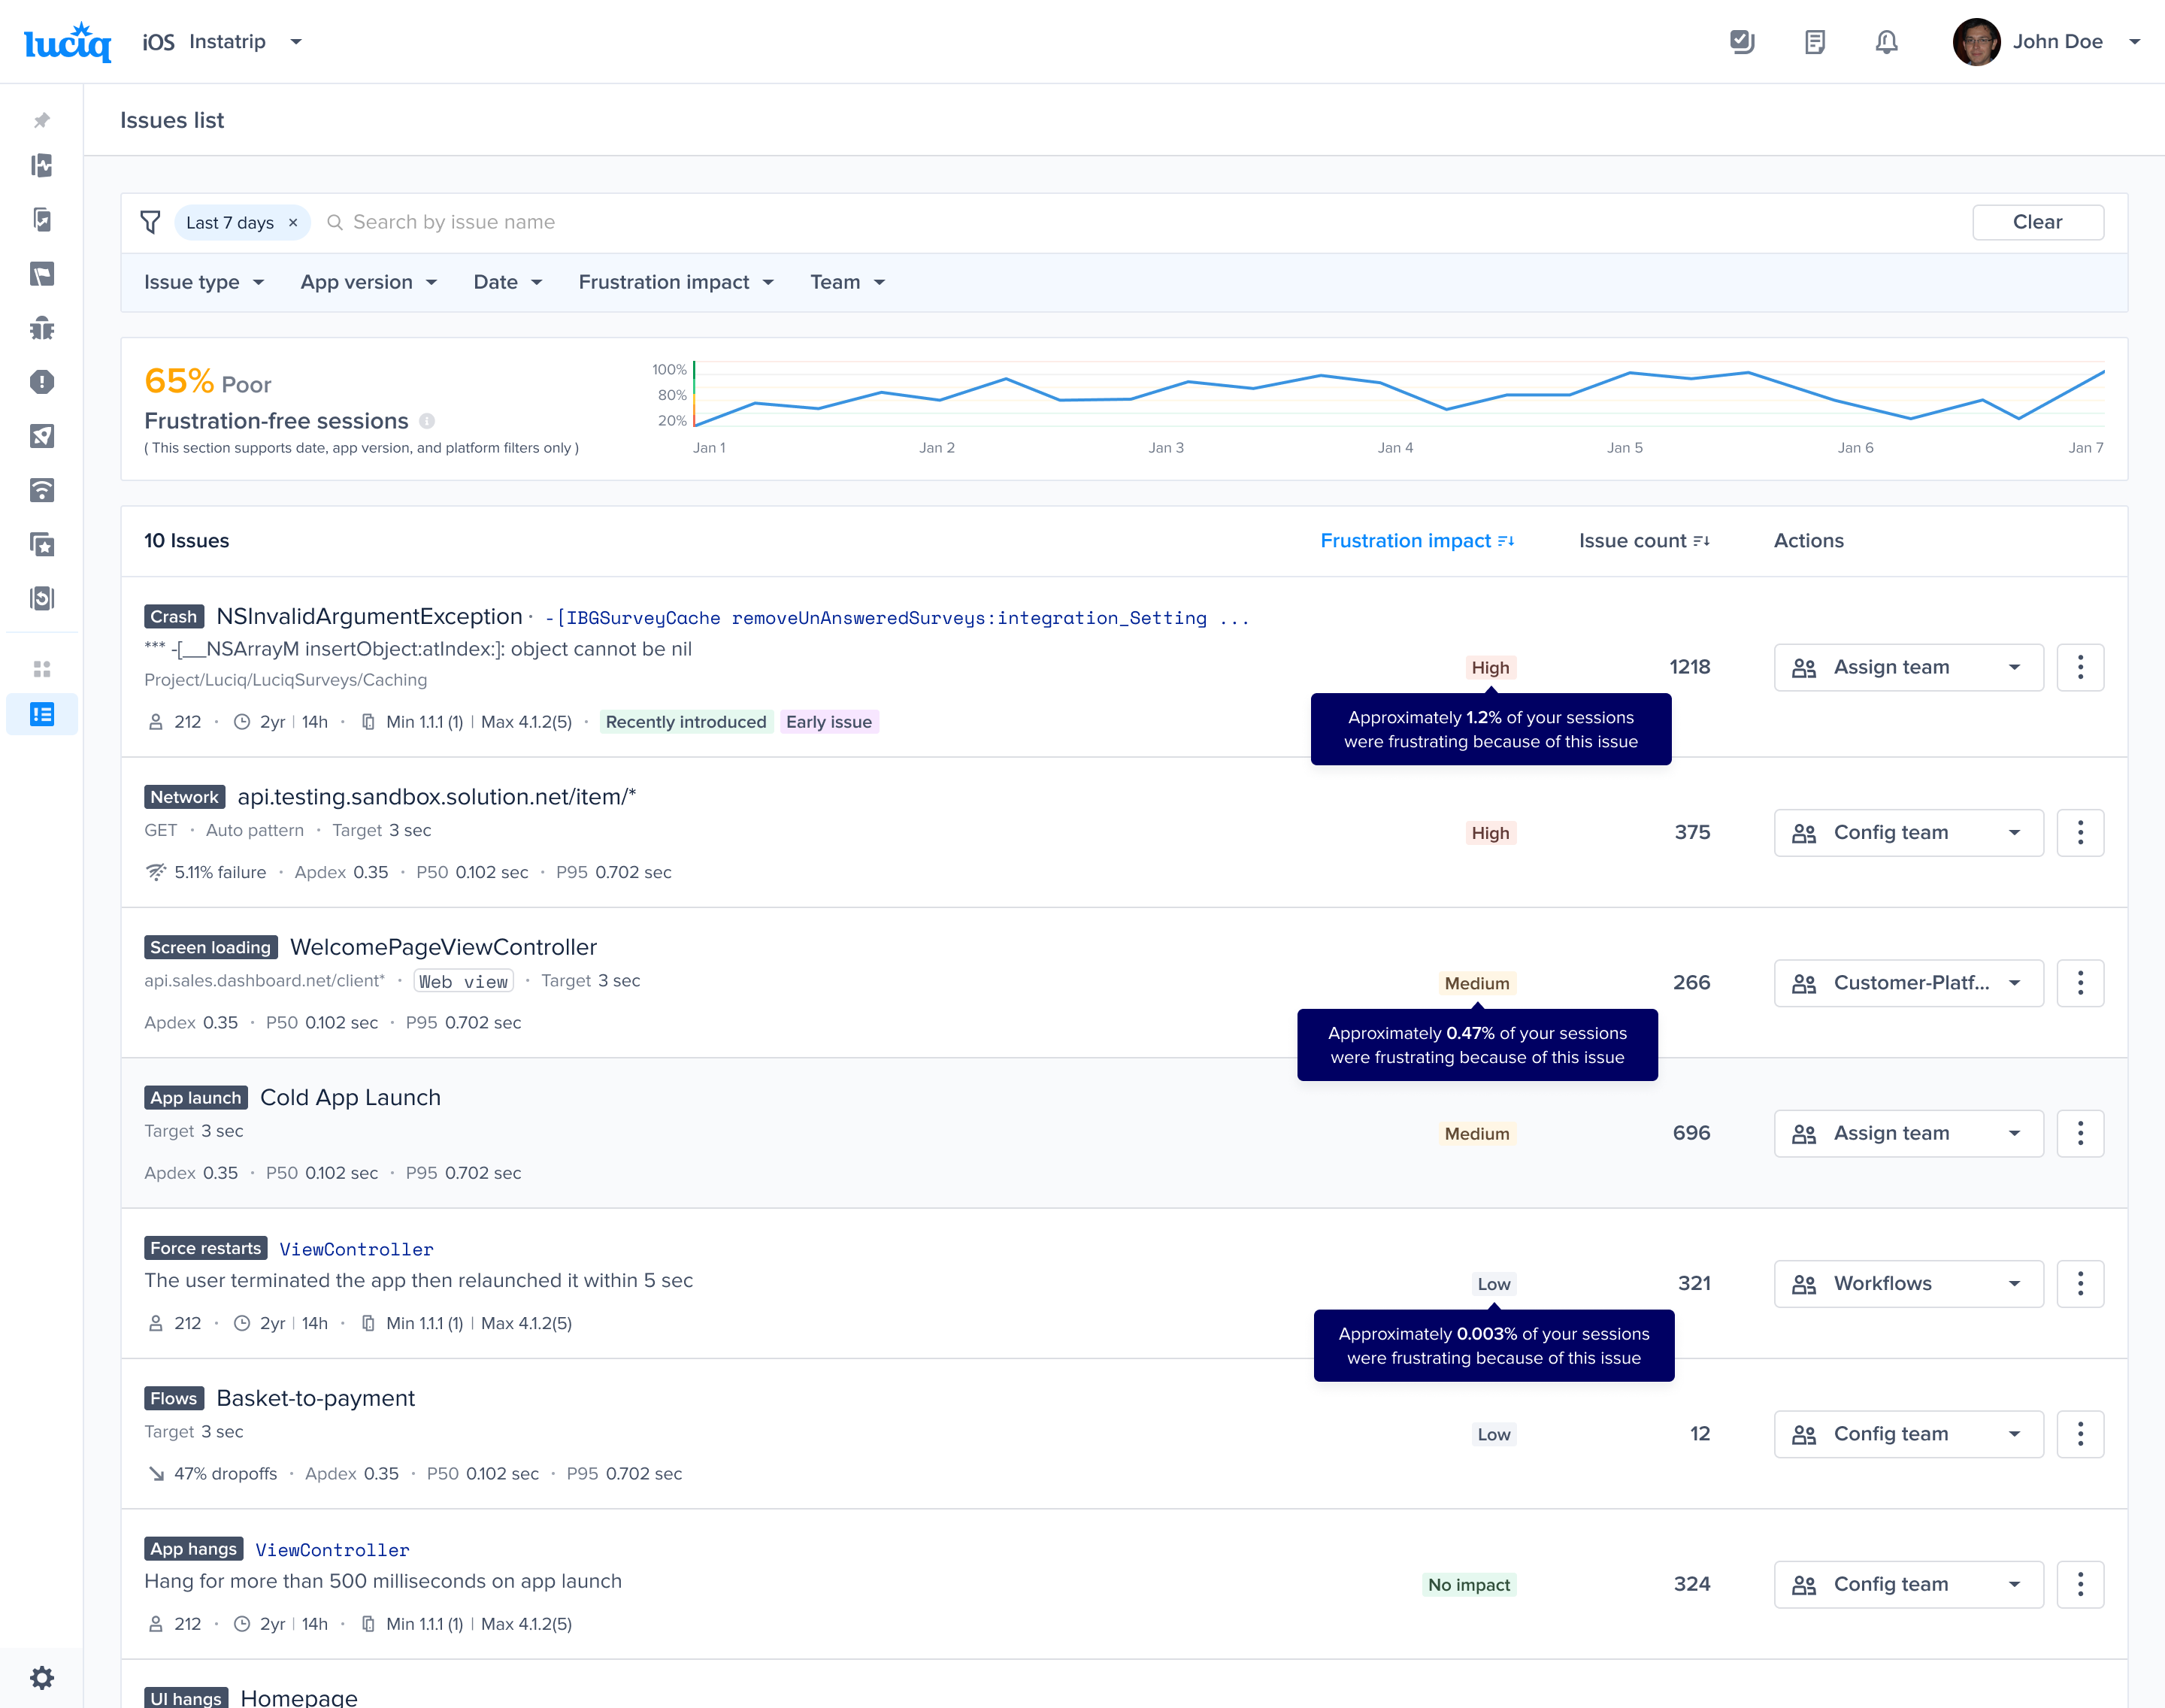
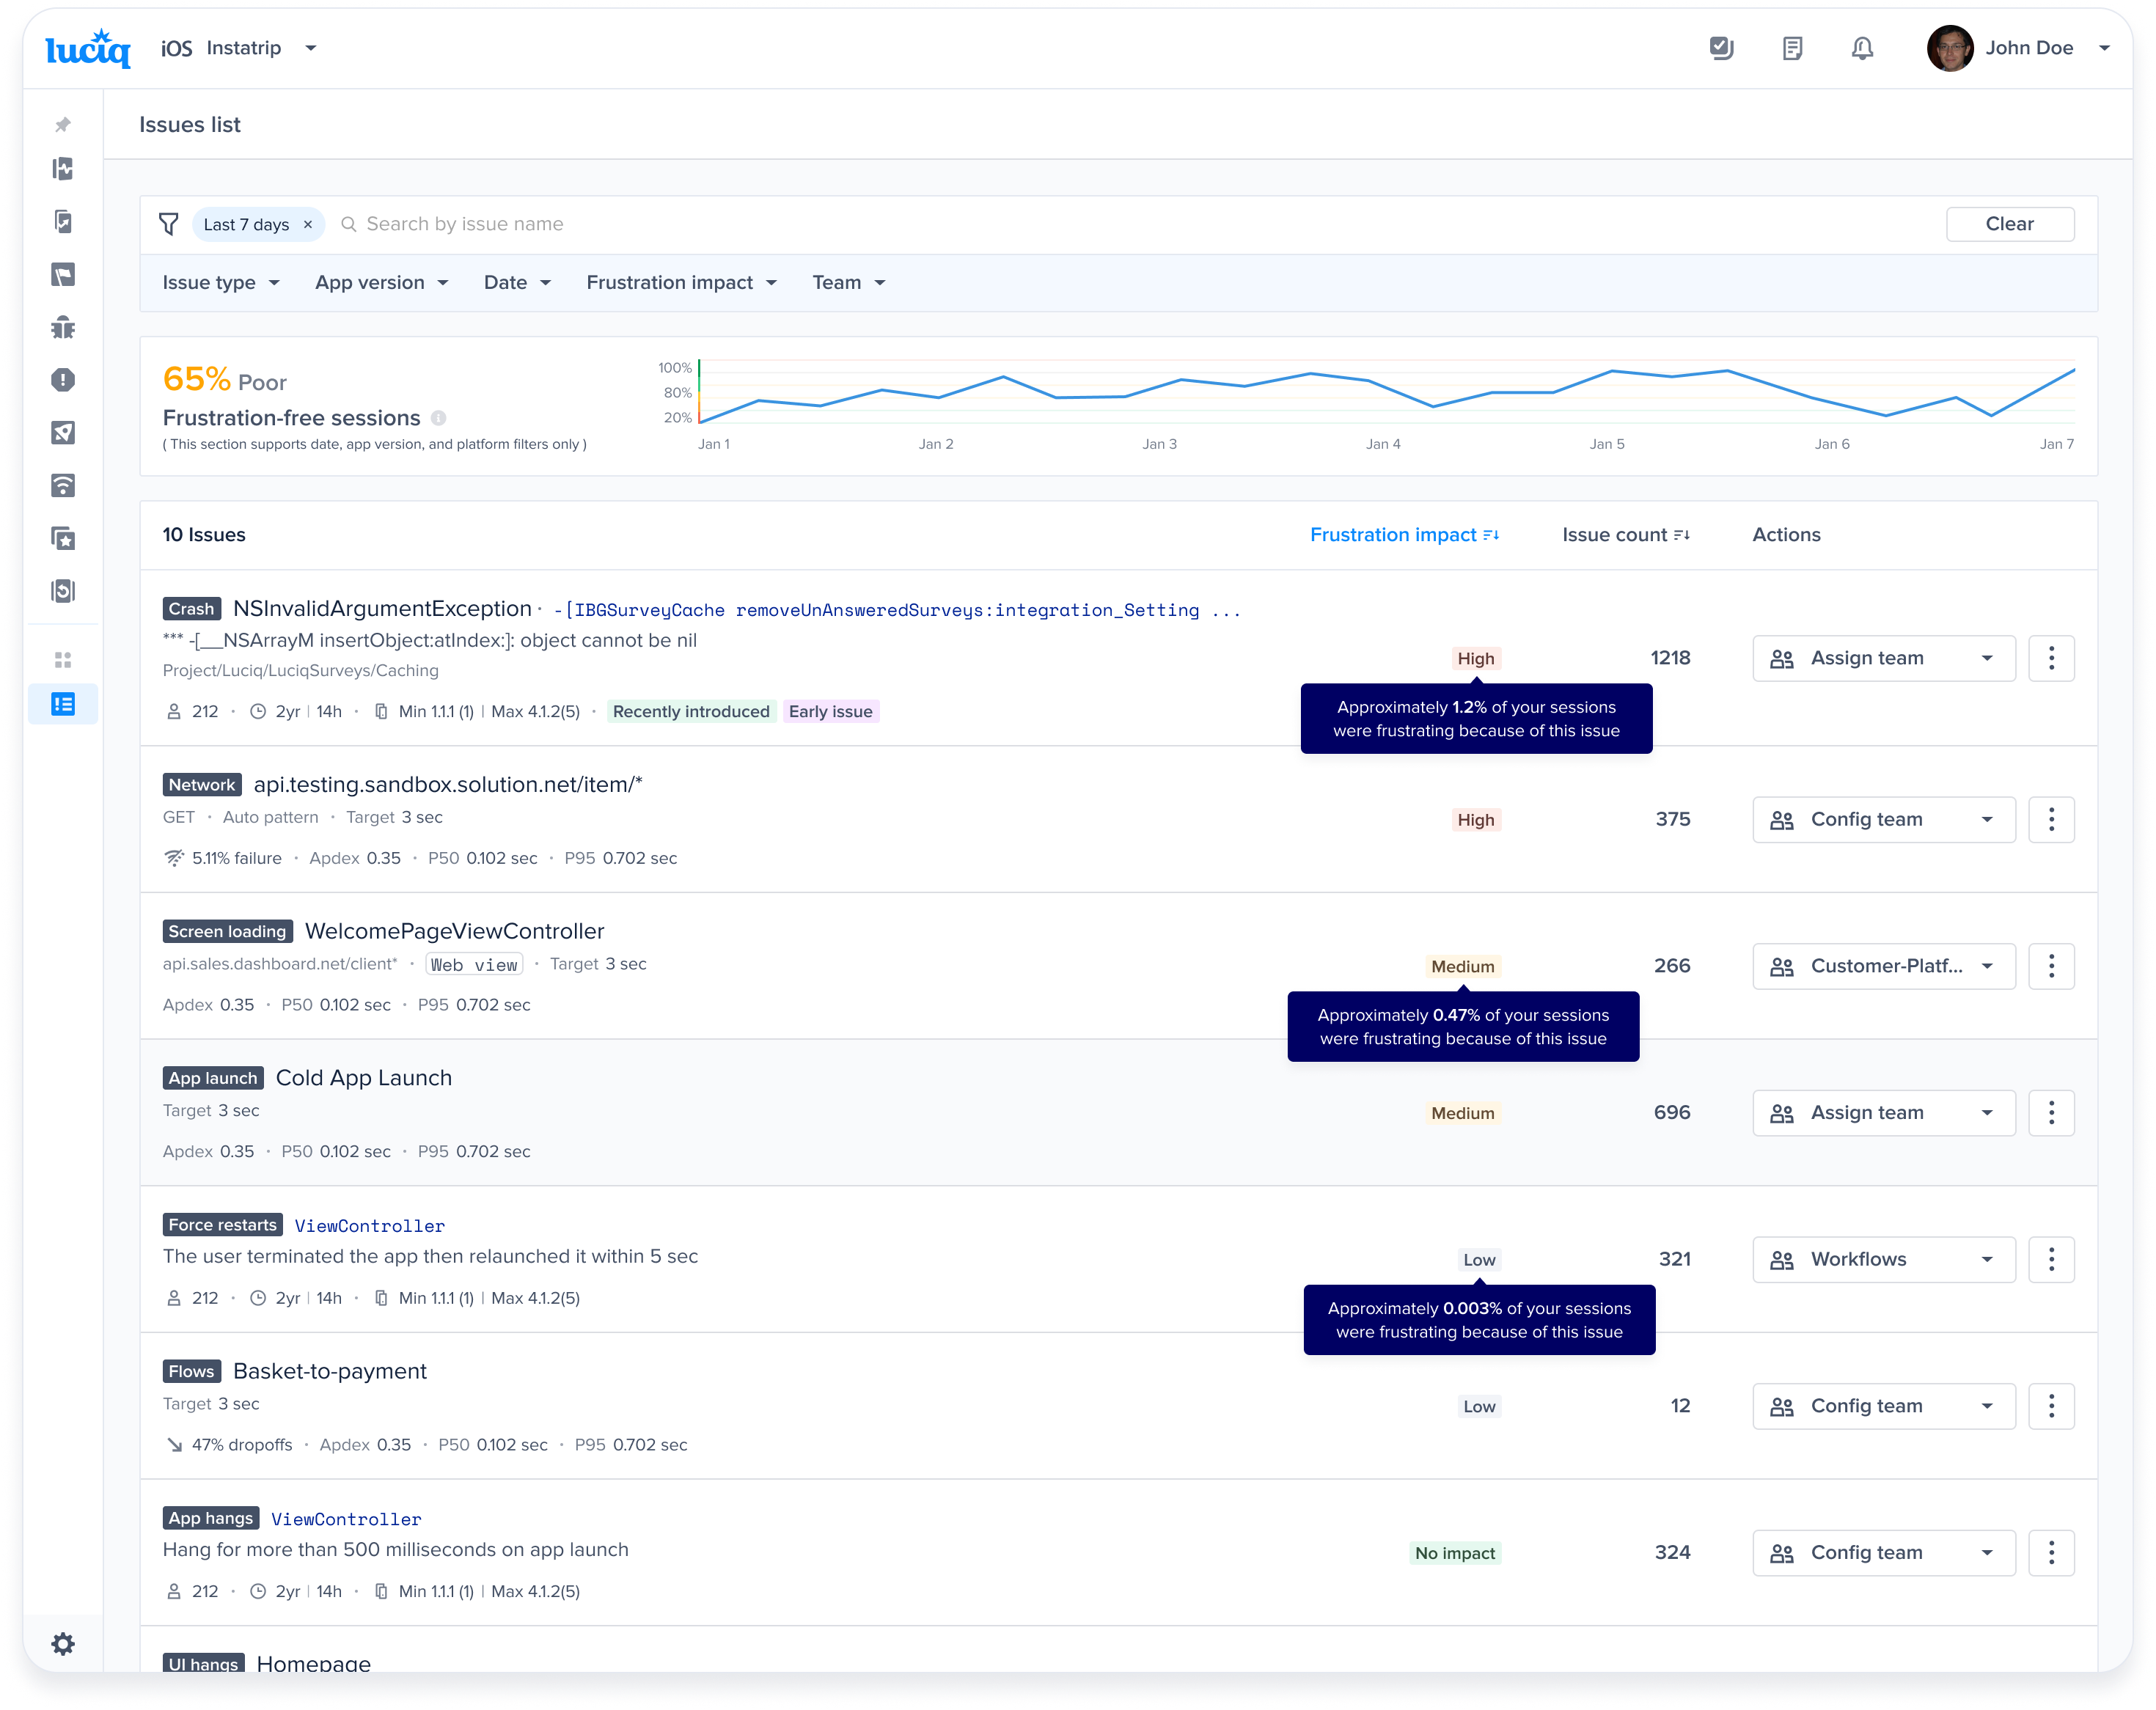
| Issue Type | Impact Level | Occurrences |
|---|---|---|
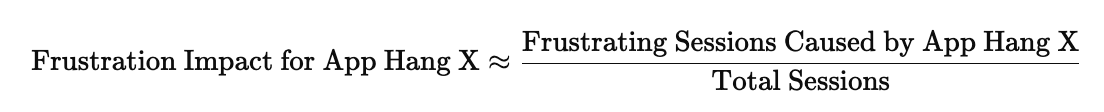
| App Hangs | High (an occurrence has a weight of 10 occurrences) | 1 (all app hang occurrences are considered frustrating) |
| Network Requests | Low (an occurrence has a weight of 0.3 occurrences) | - 2 Frustrating - 2 Tolerable - 1 Satisfying |
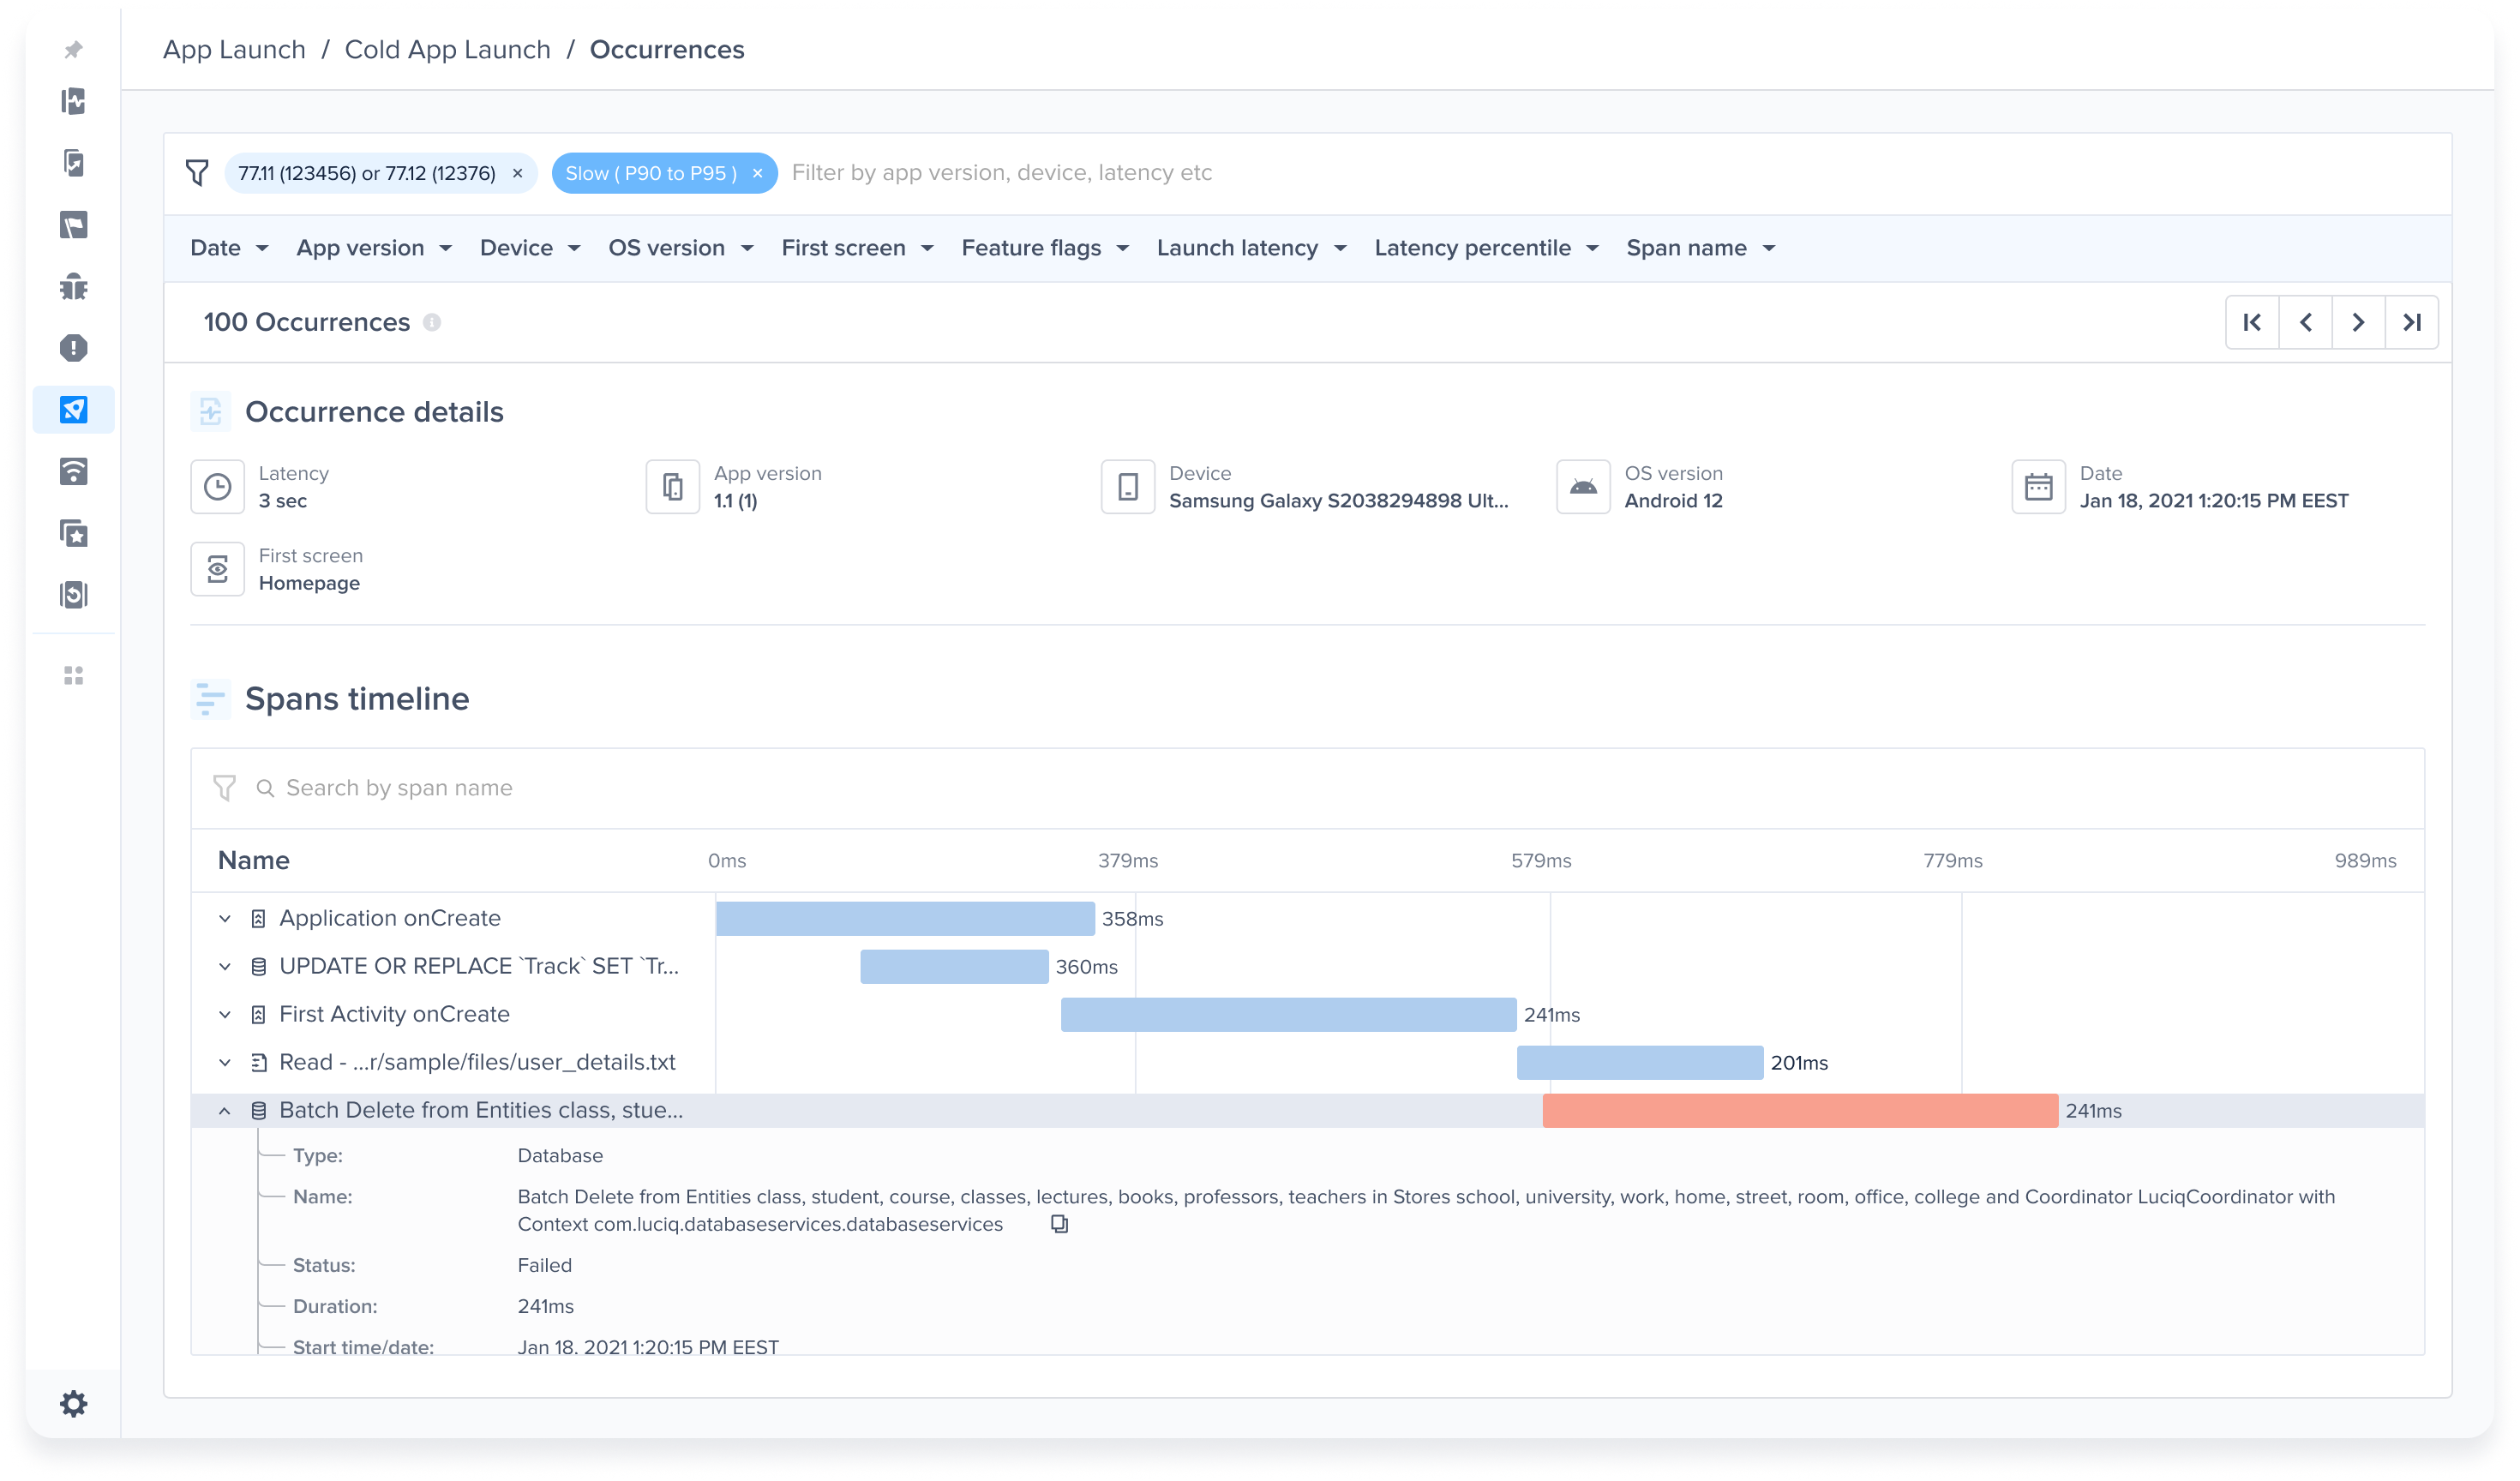
| App Launch | Medium (an occurrence has a weight of 1 occurrence) | - 3 Frustrating |
| Flows | Medium (an occurrence has a weight of 1 occurrence) | - 2 Satisfying |


Setting a rule for master reports
Setting a rule for duplicate reports
Triage Agent's comment on Luciq's dashboard
Triage Agent's comment inside the Jira ticket
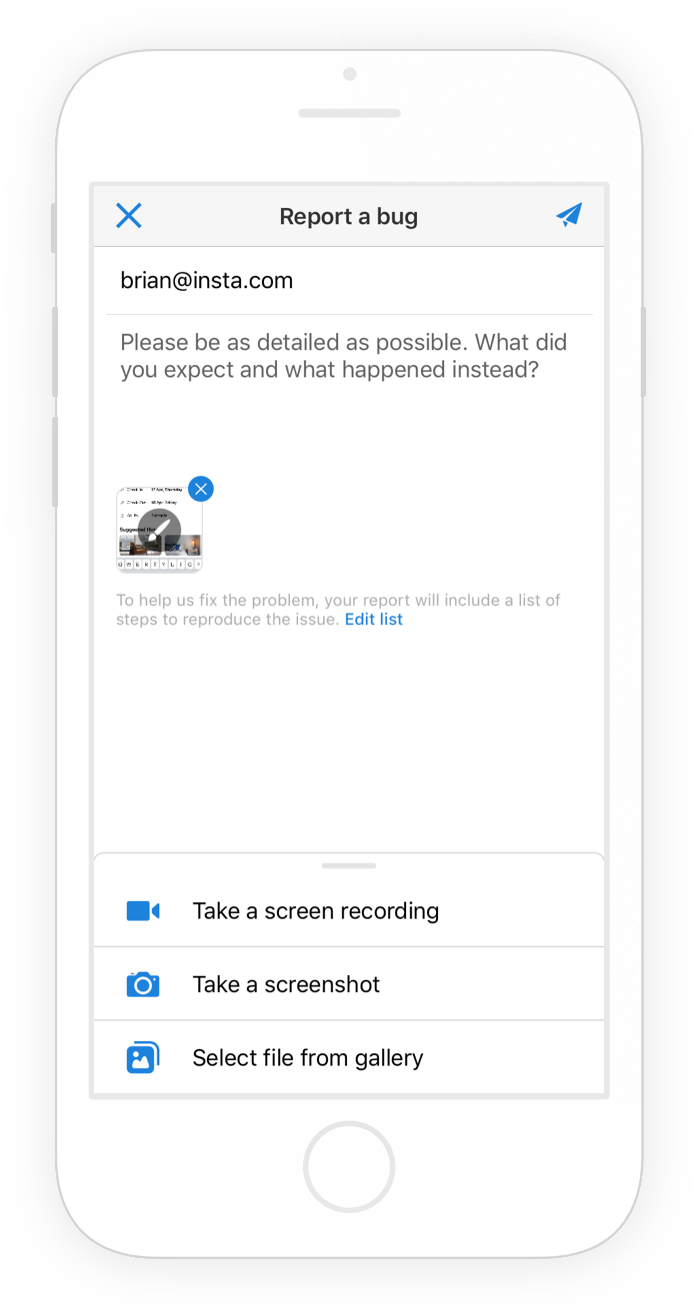
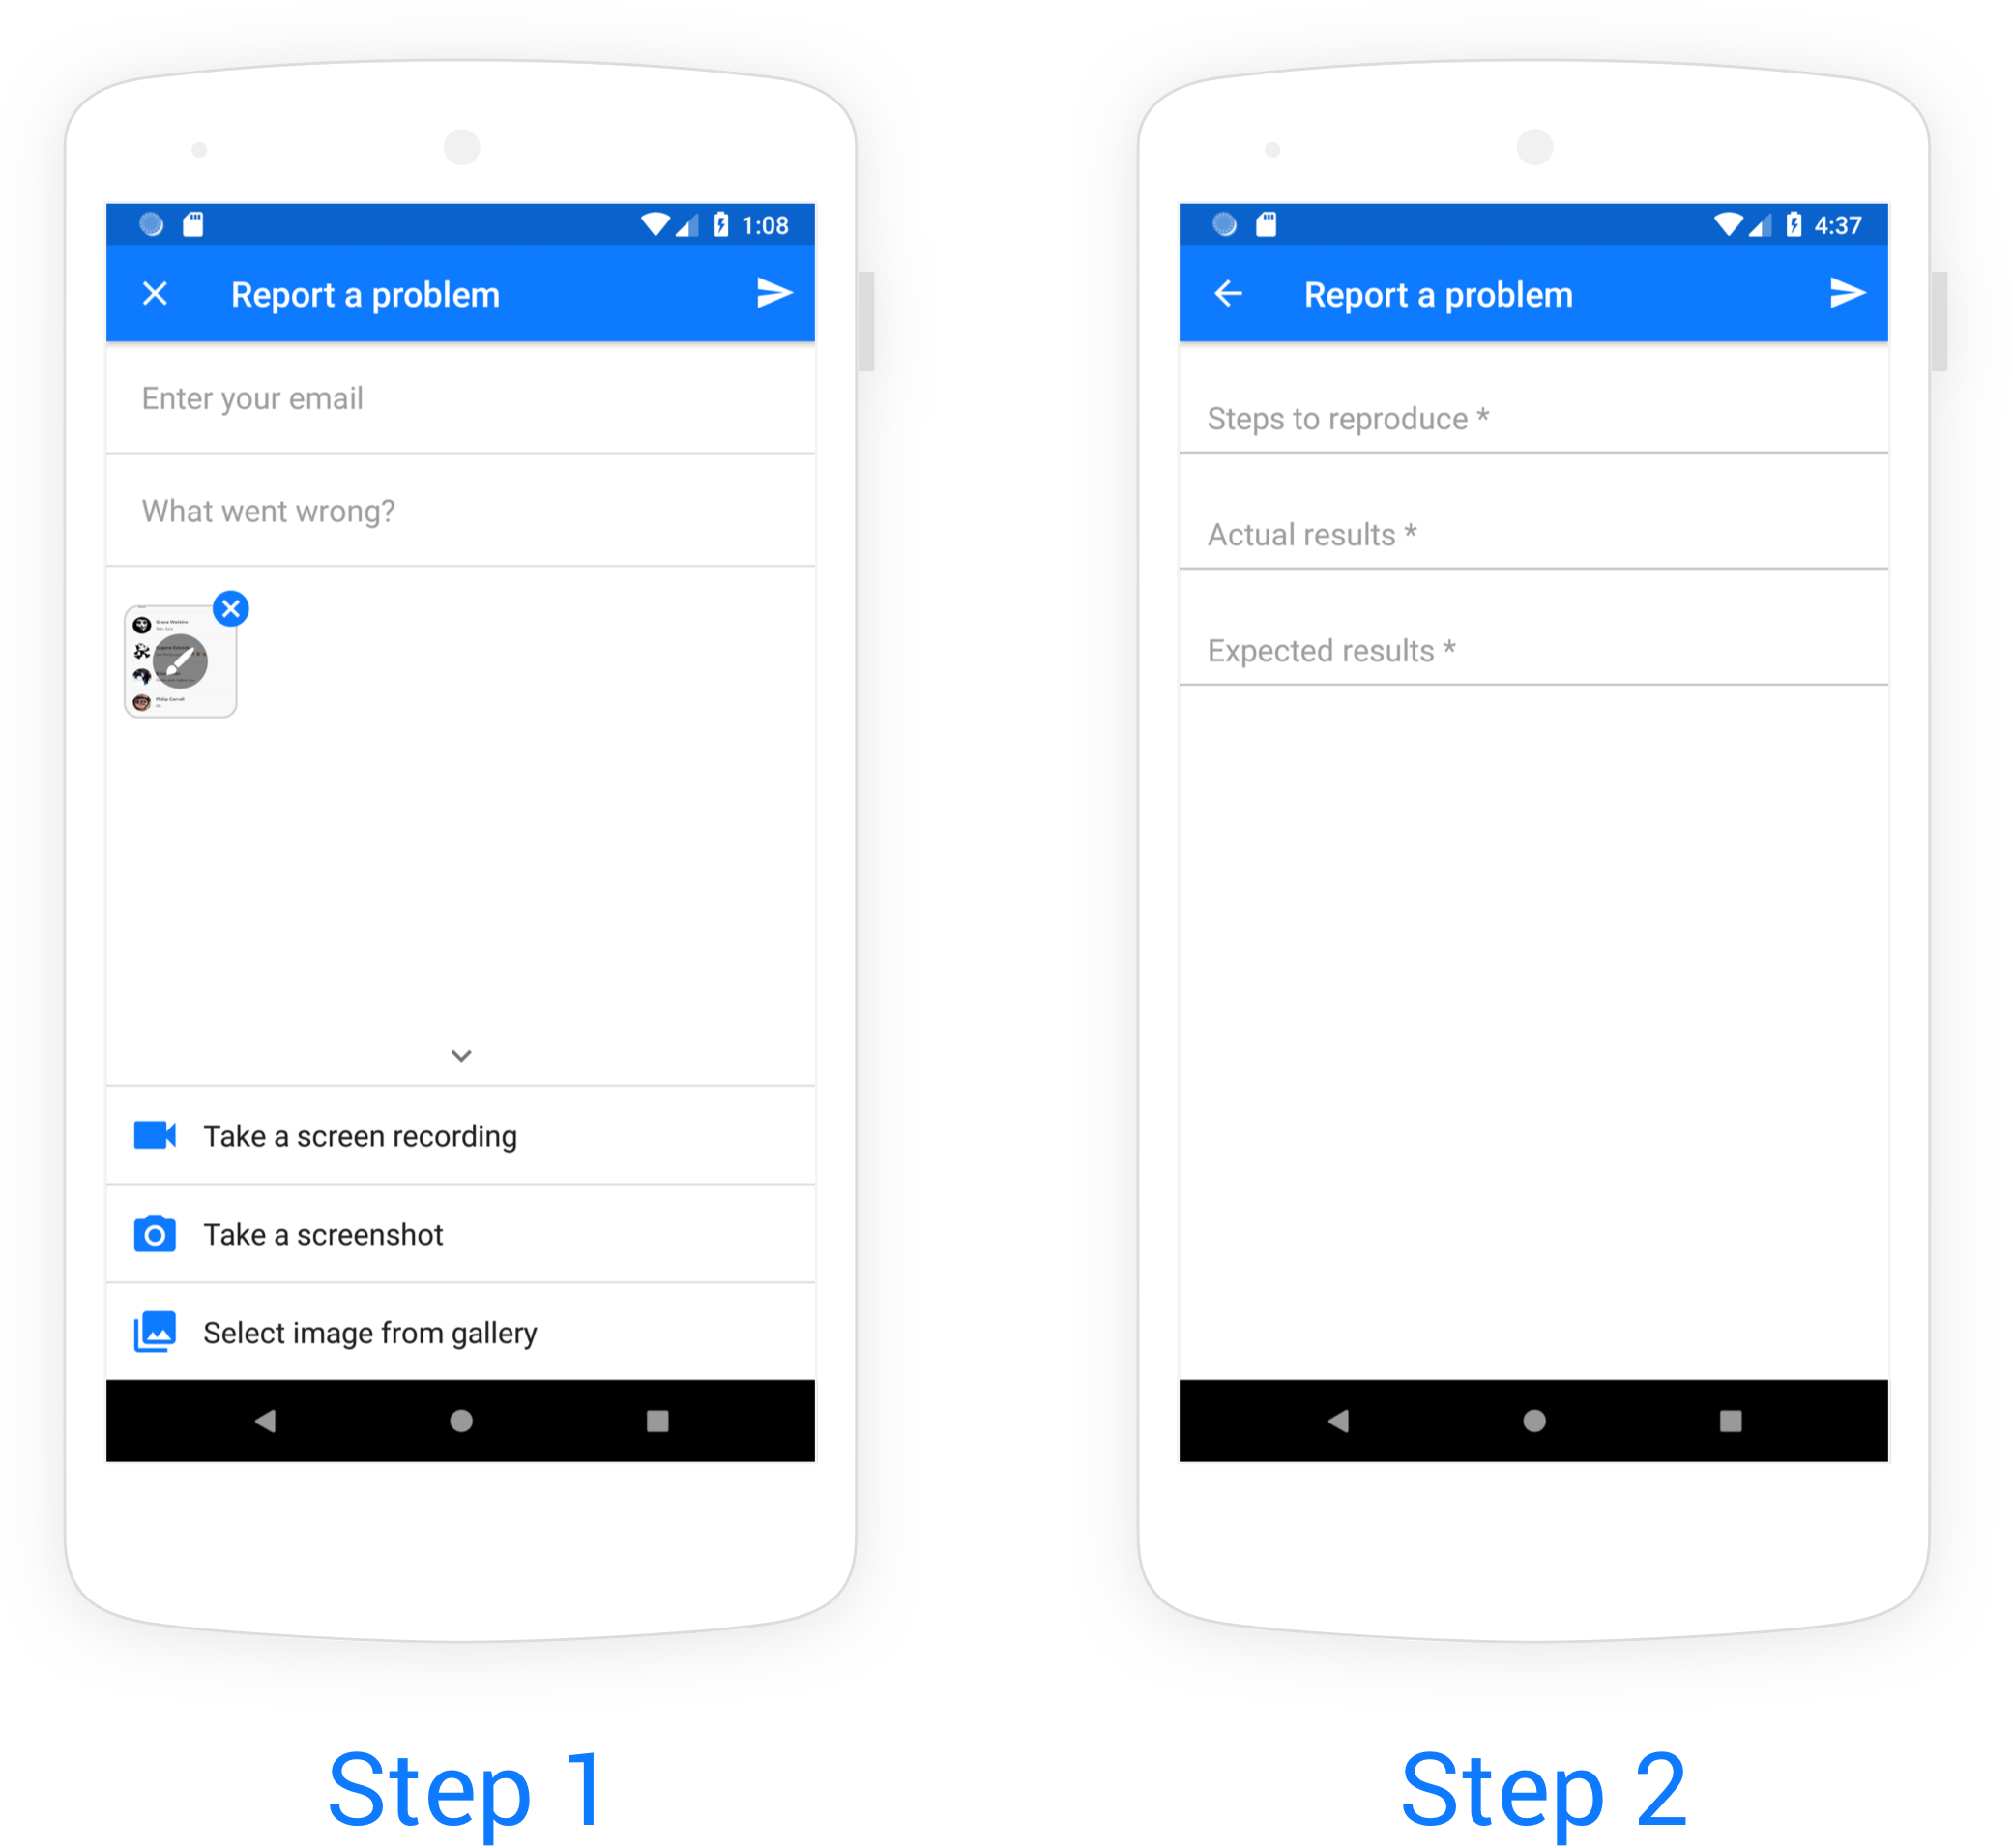
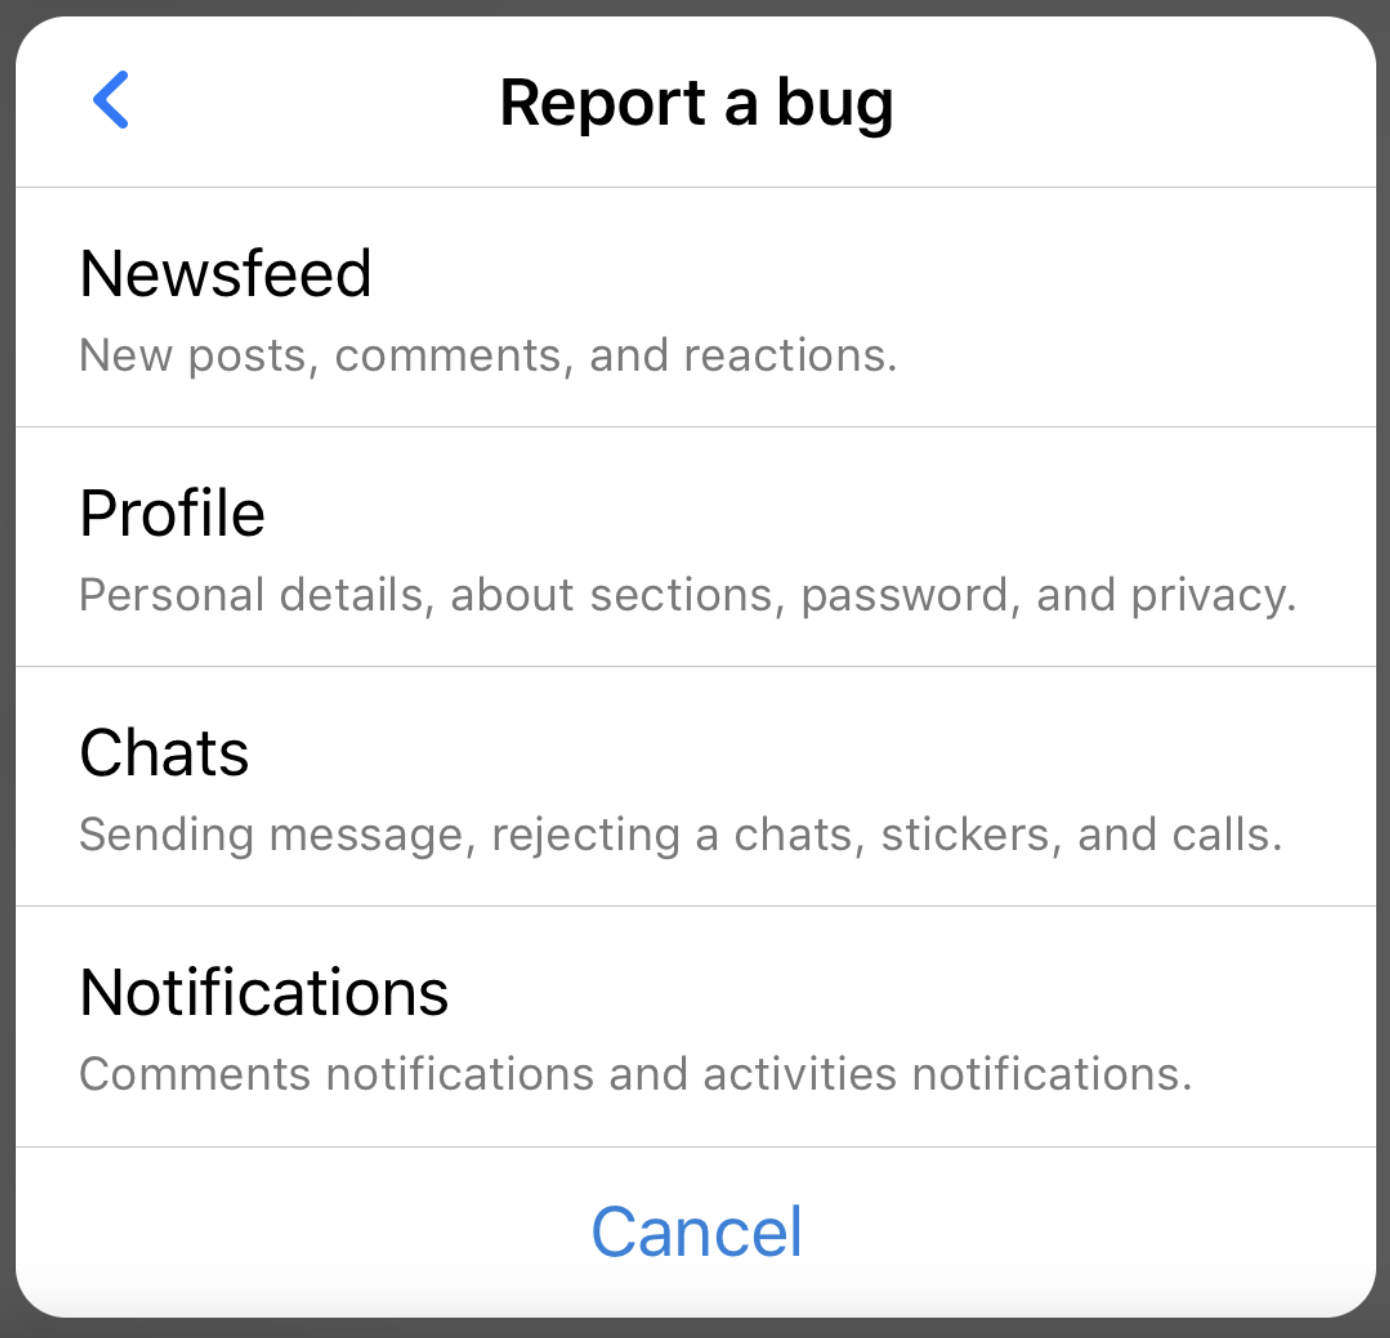
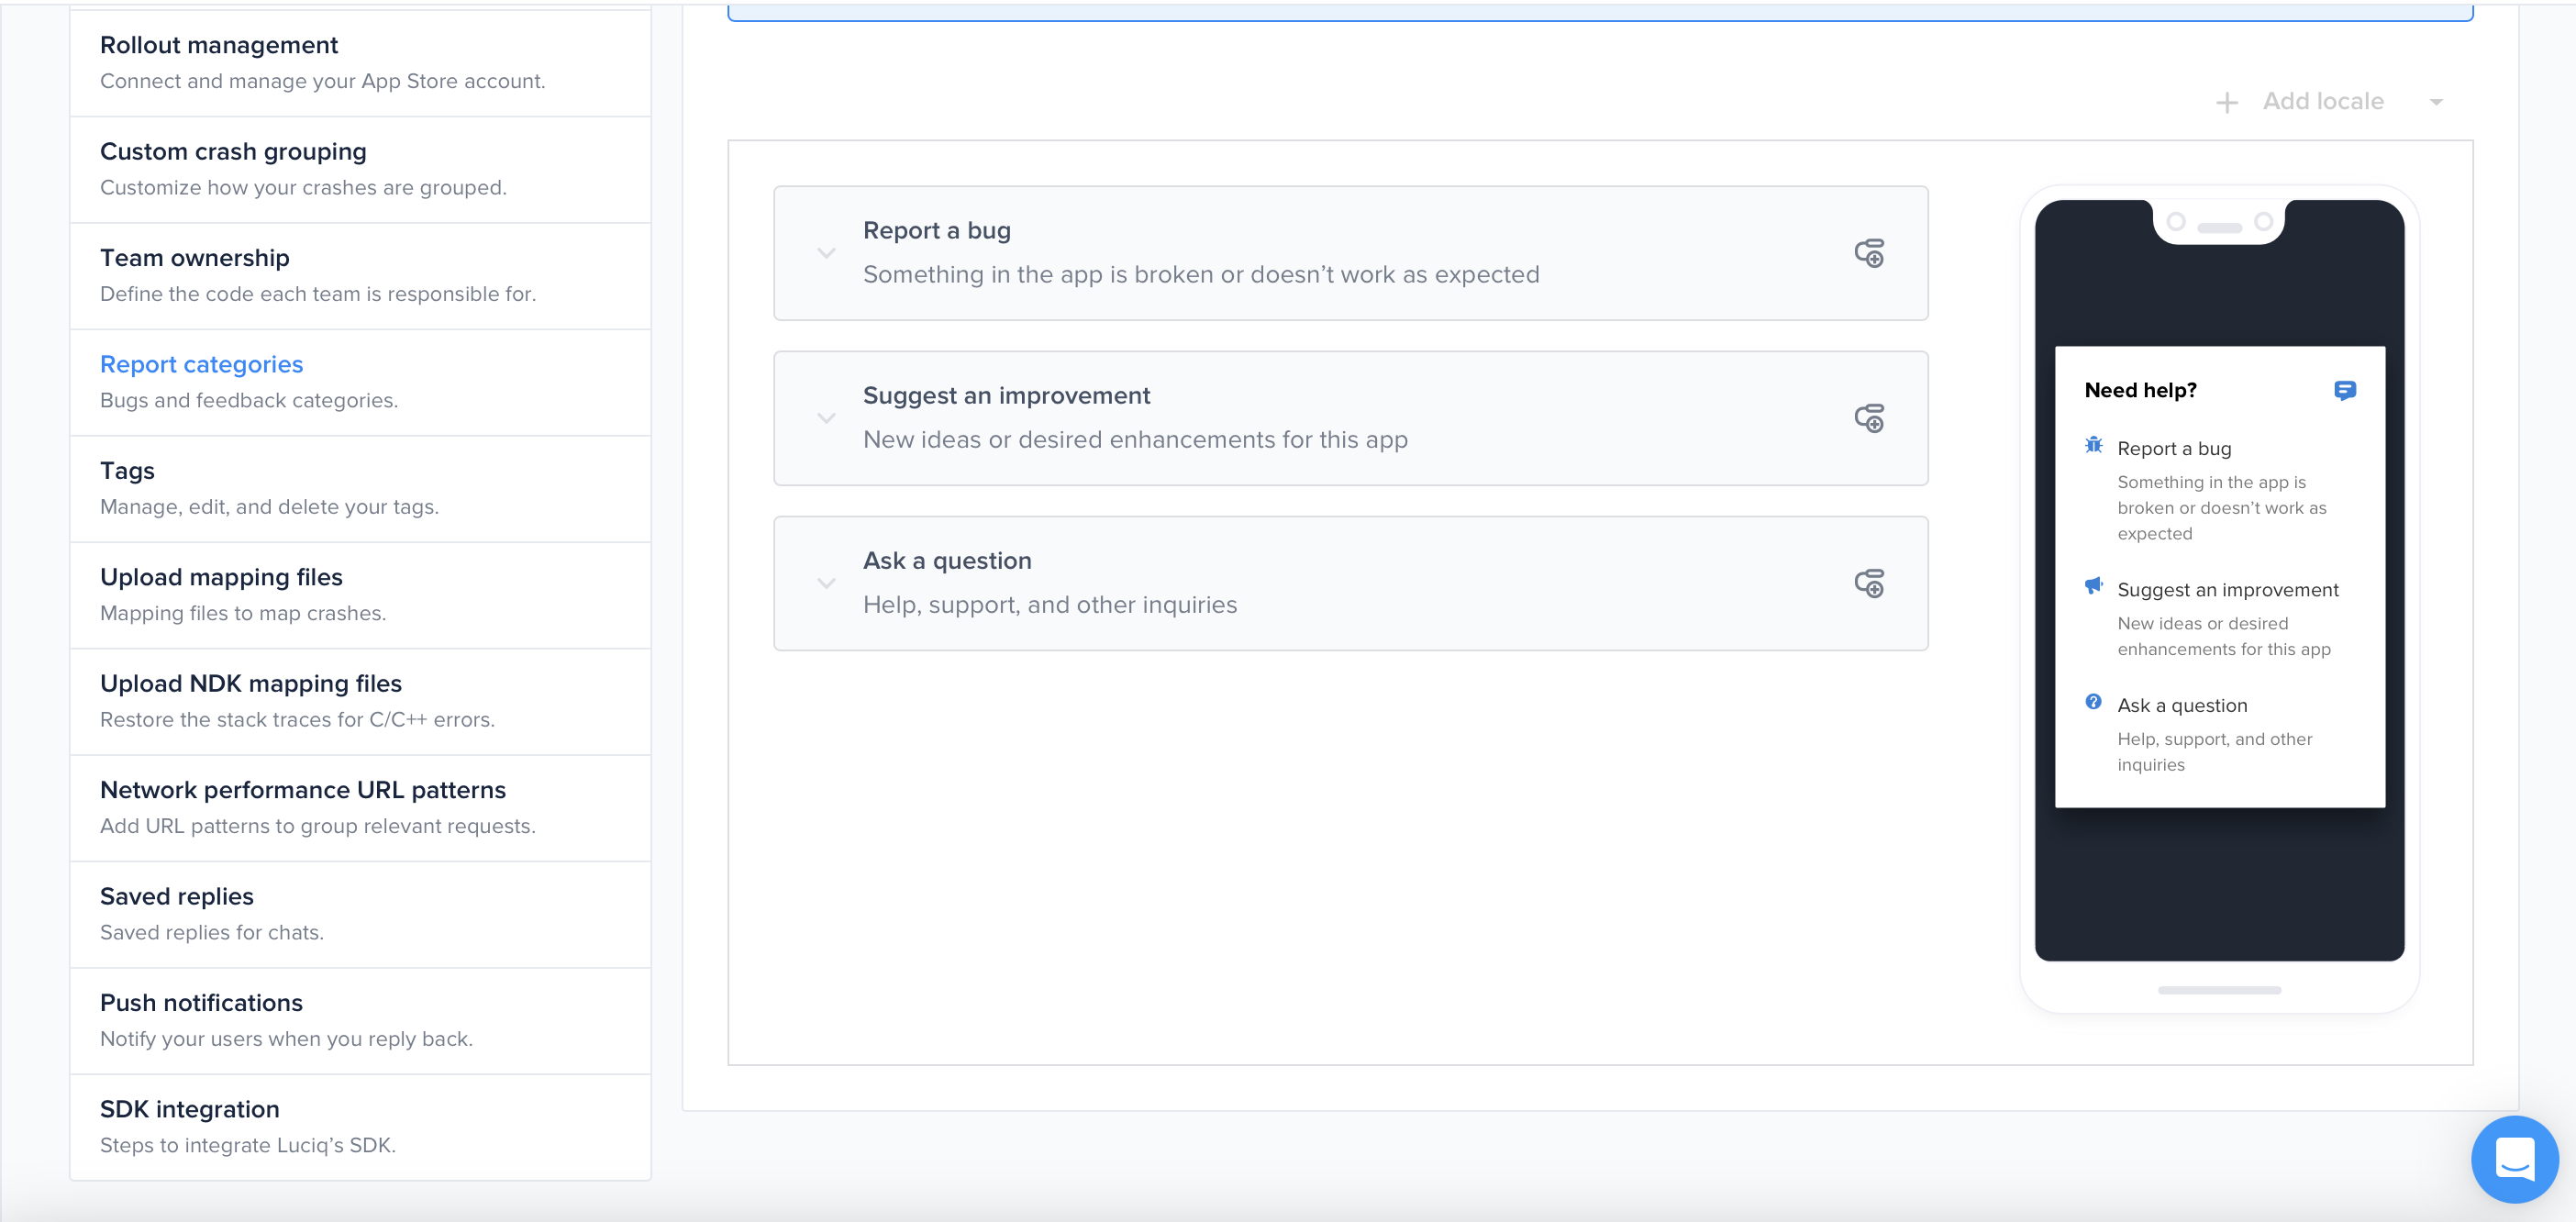
The first step of the bug reporting flow that your app users experience.
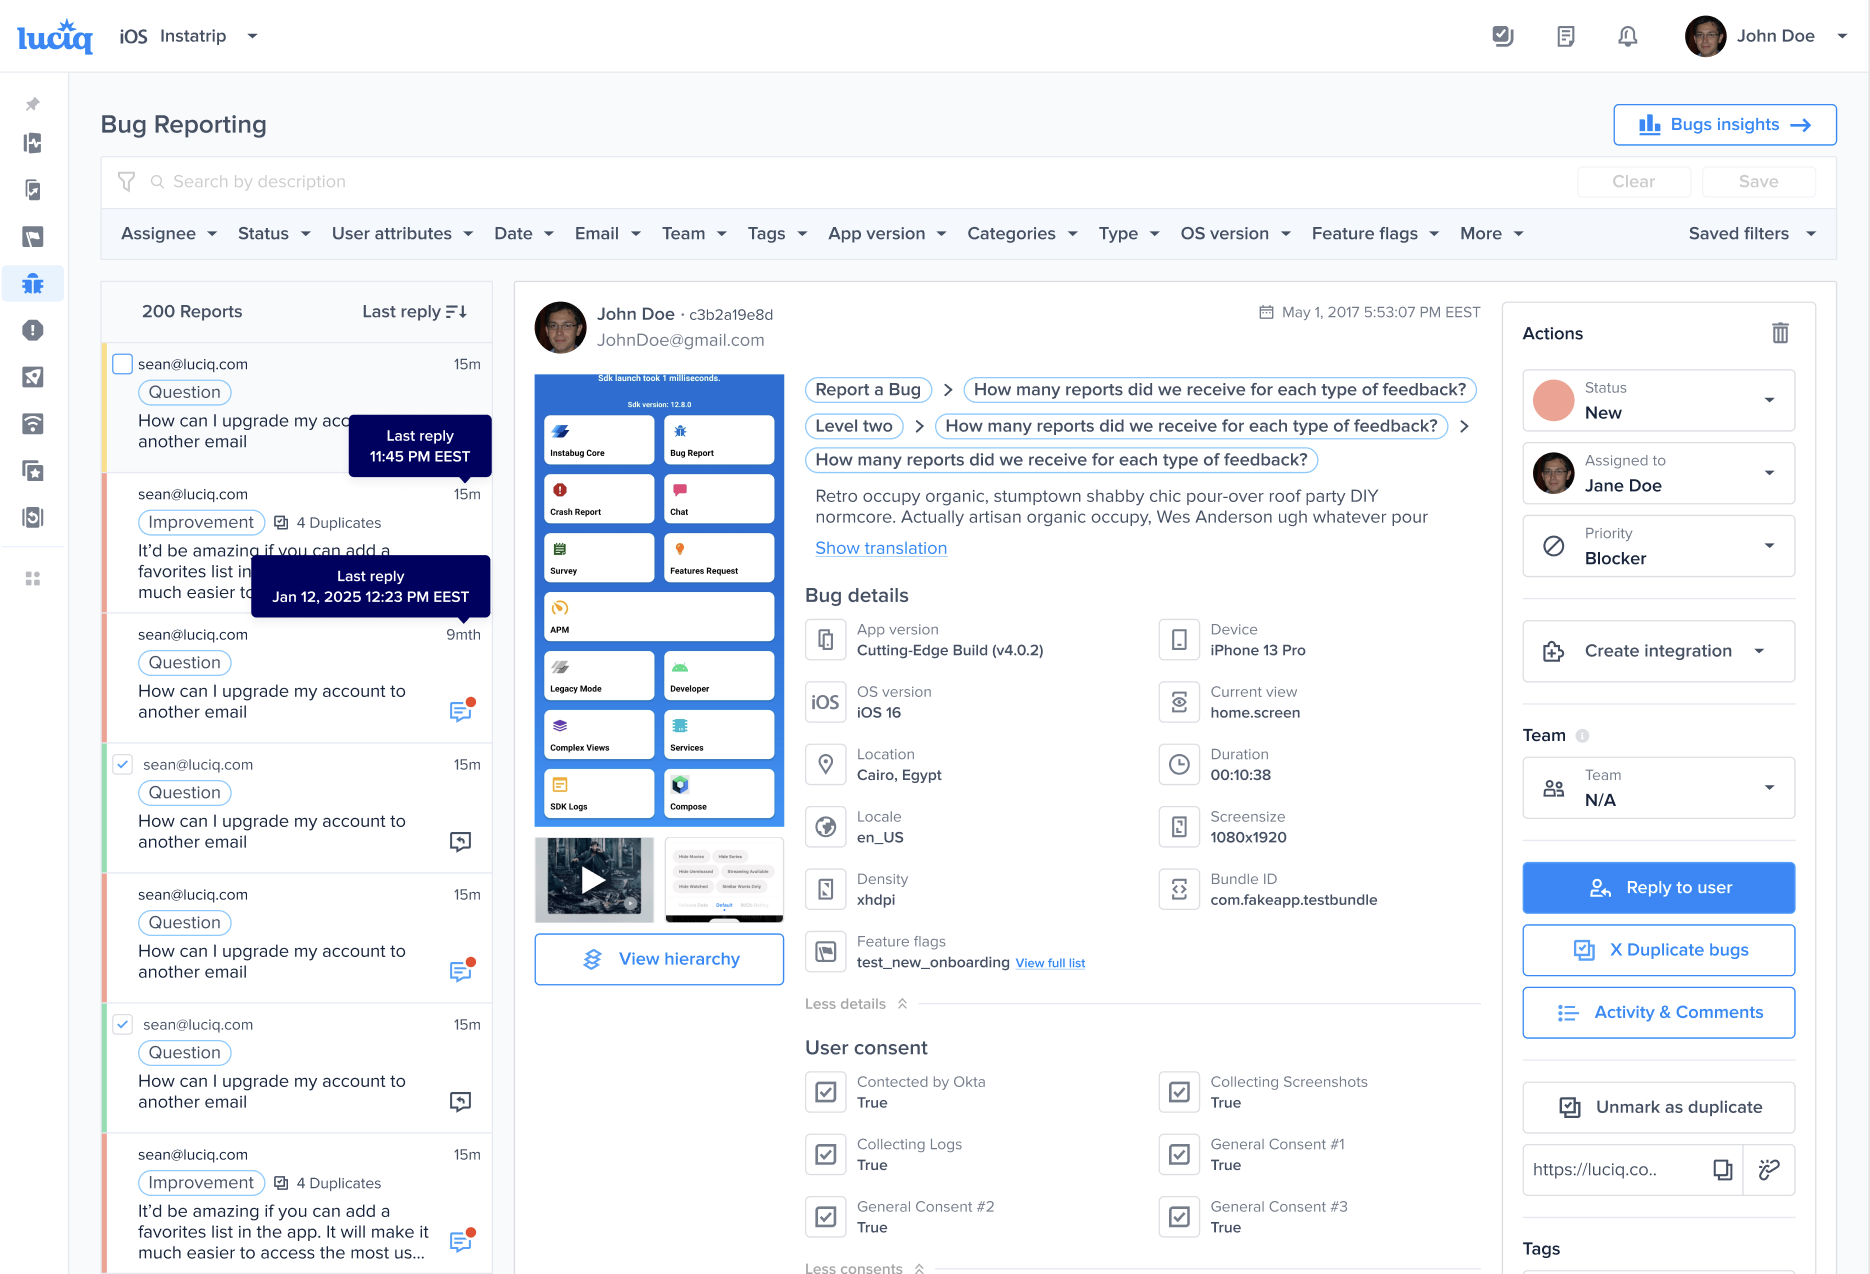
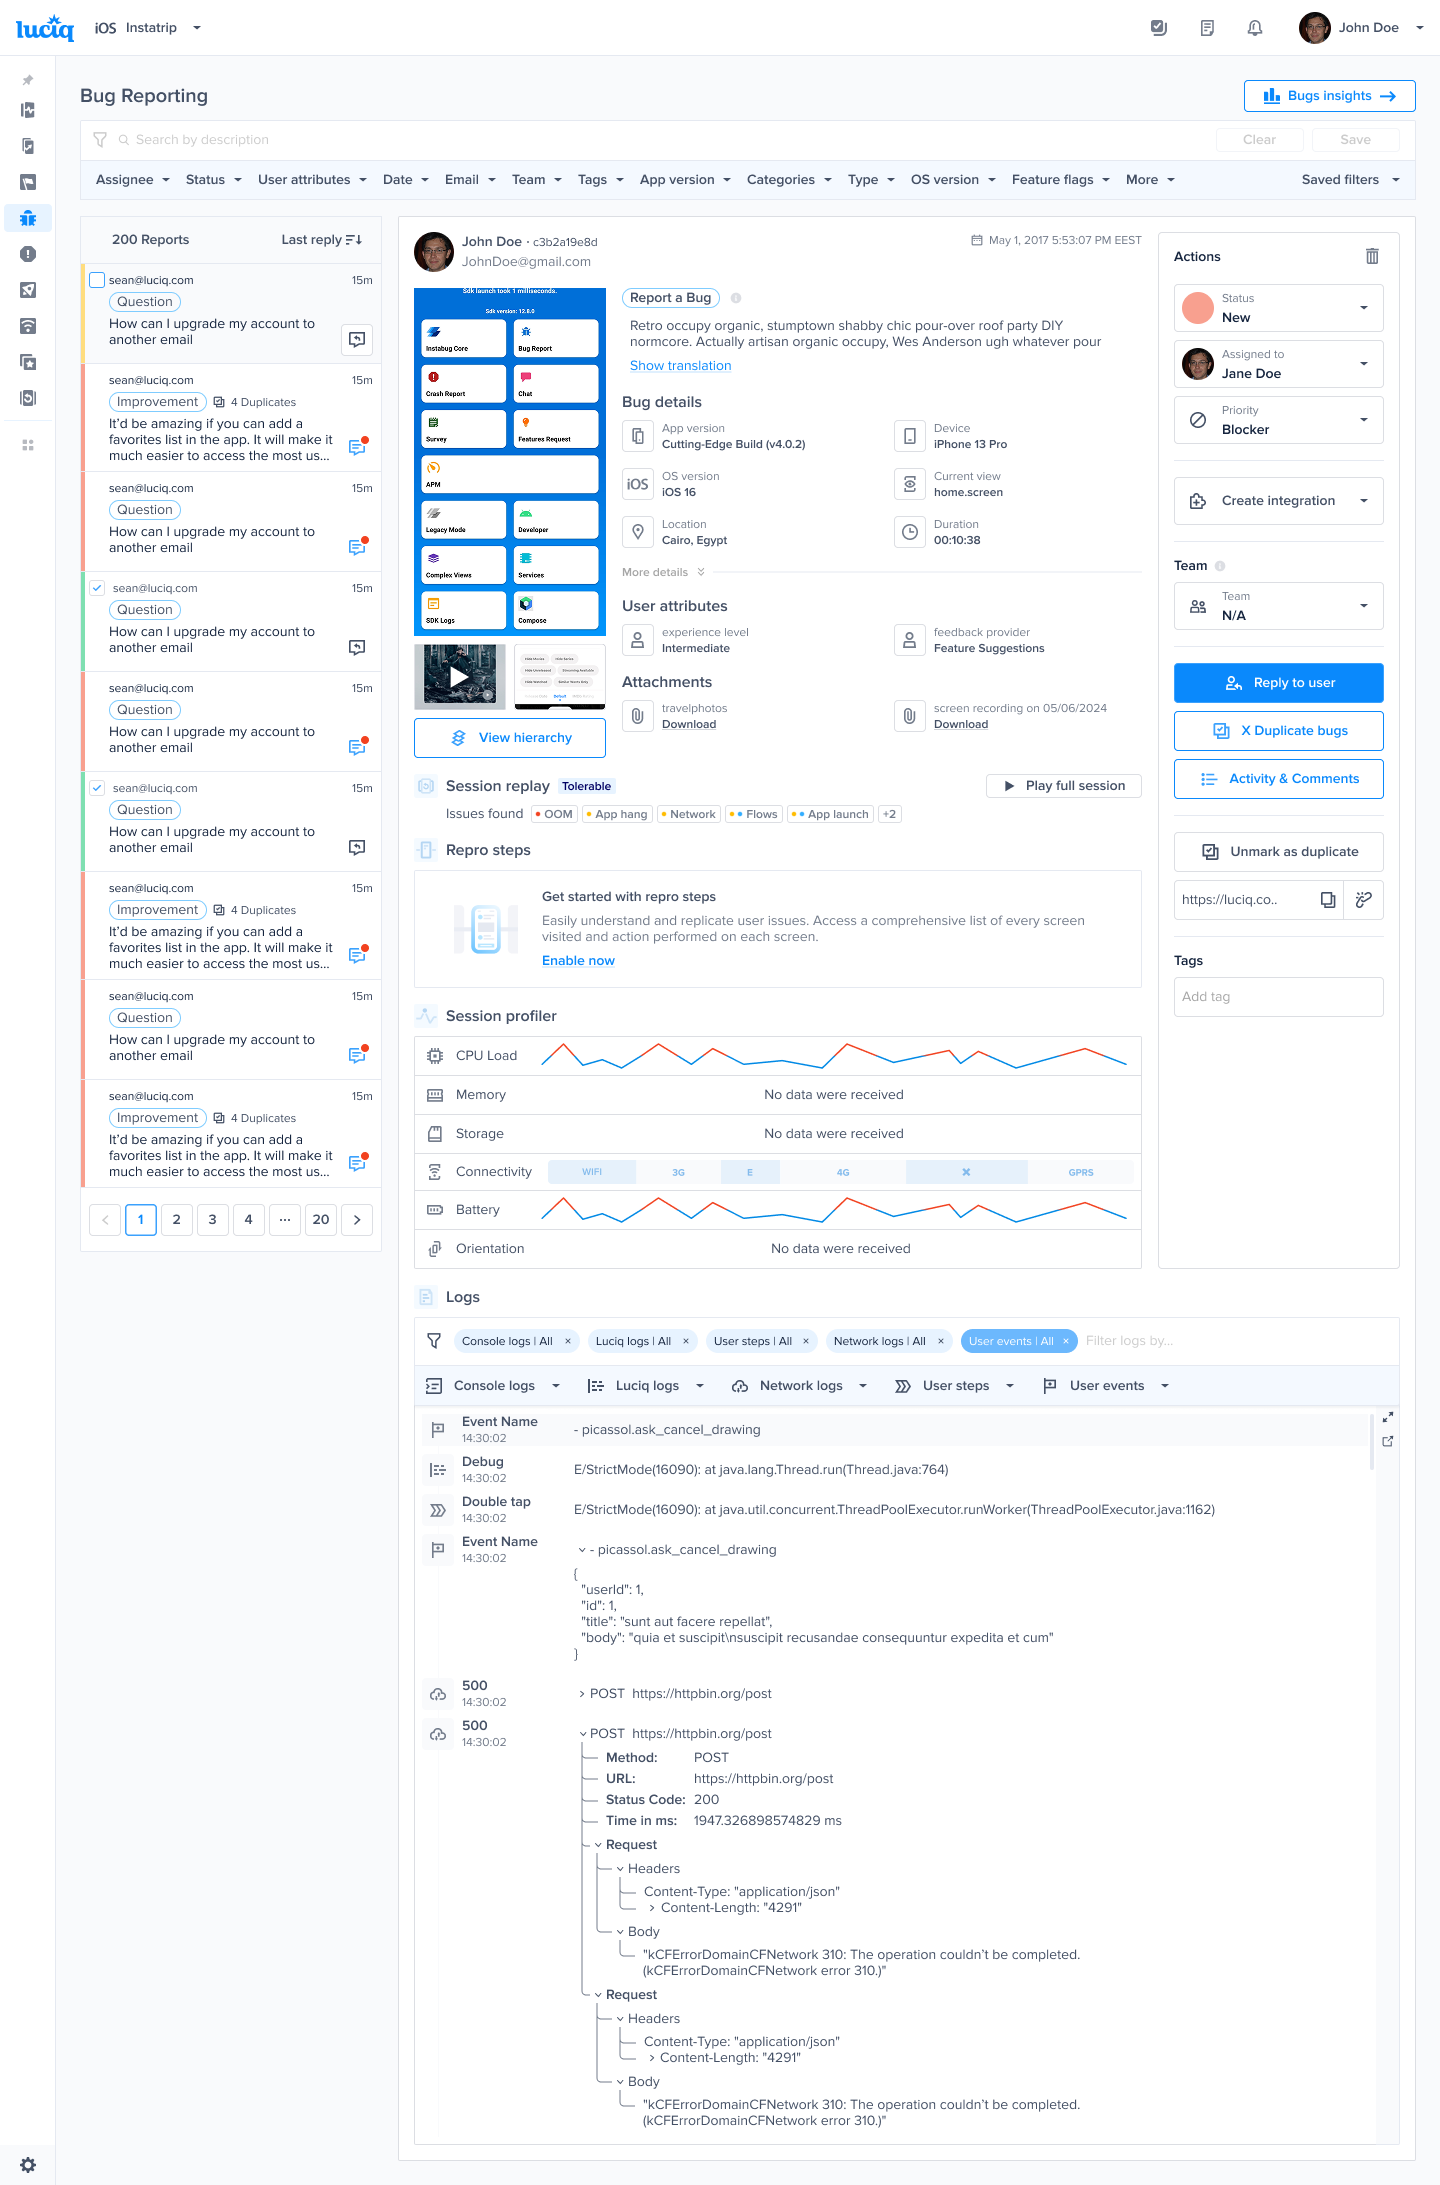
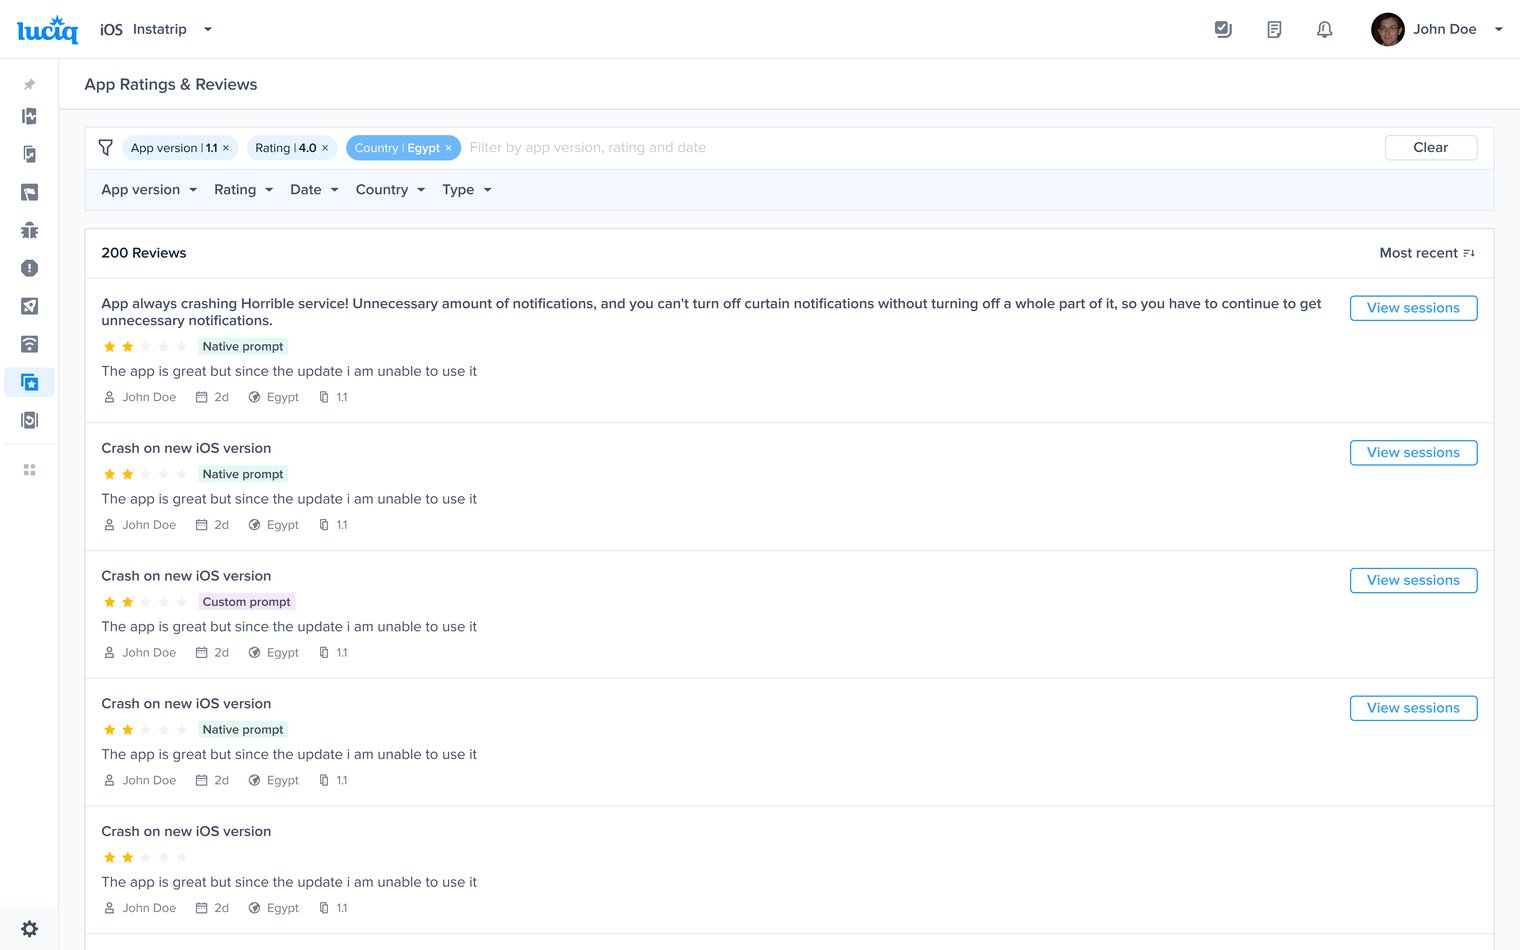
The chat icons are visible in your list of reports on the lefthand side of the bugs page in your dashboard
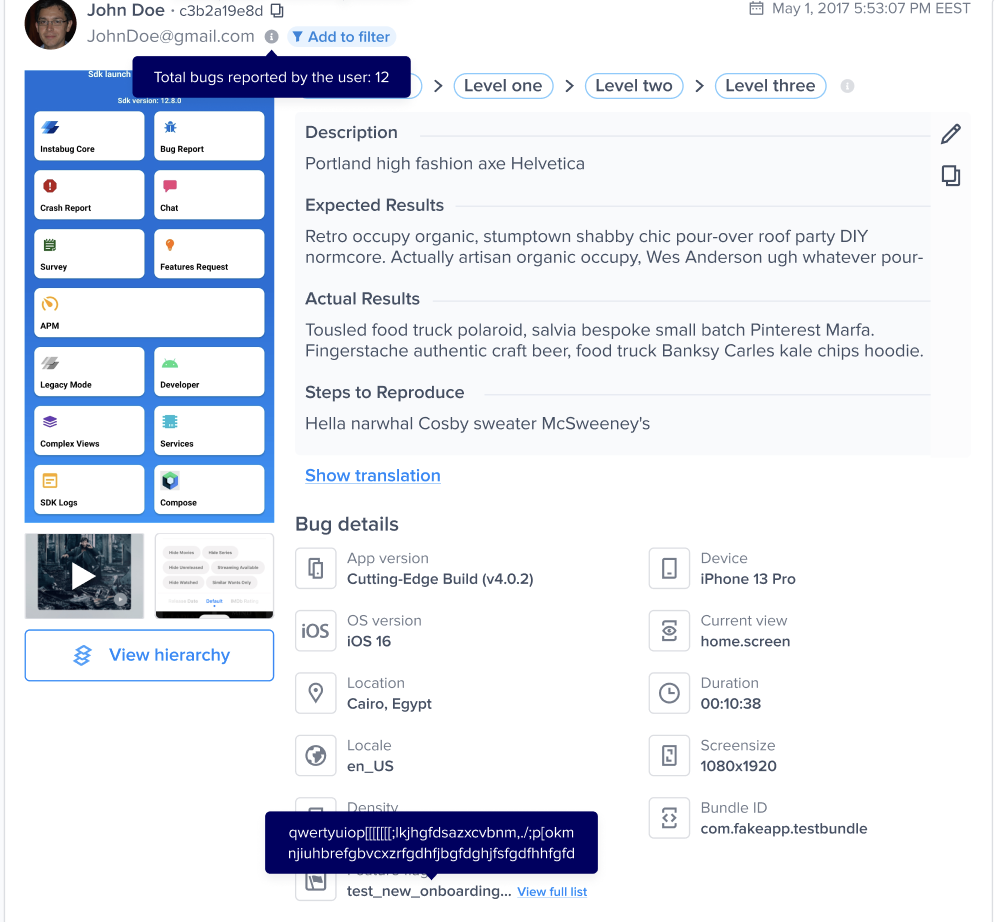
The Extended Bug Report includes additional fields for your testers to complete when sending reports.


| Mode | What it does |
|---|---|
| Debug mode | Interactive AI analysis for investigating the crash with follow-up questions. |
| Agent mode | Structured crash aggregations formatted for your AI coding agent. Copy or export as Markdown, then paste directly into Cursor, Claude Code, Copilot, or any agent. |

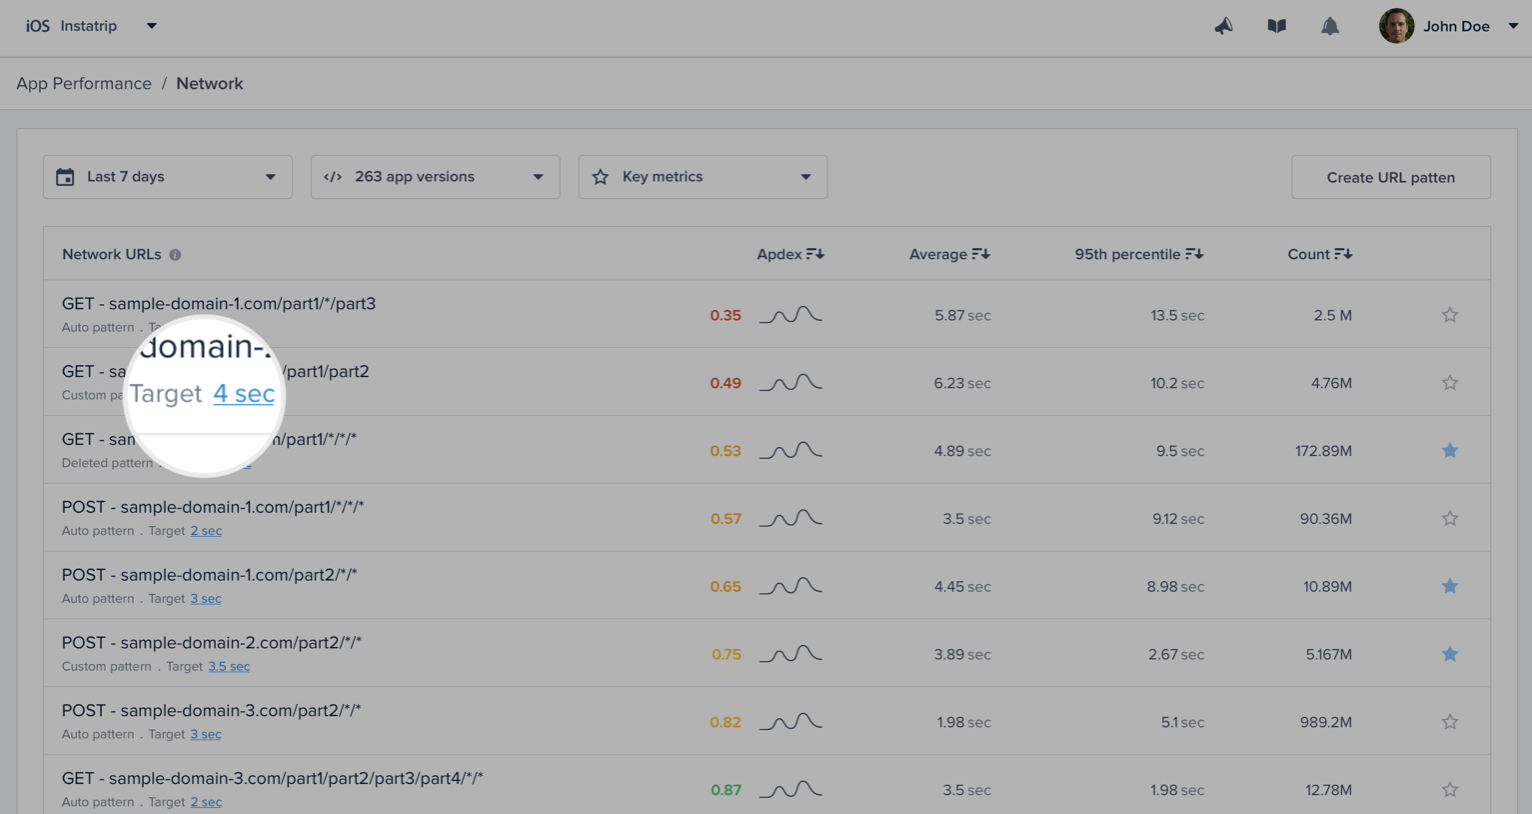
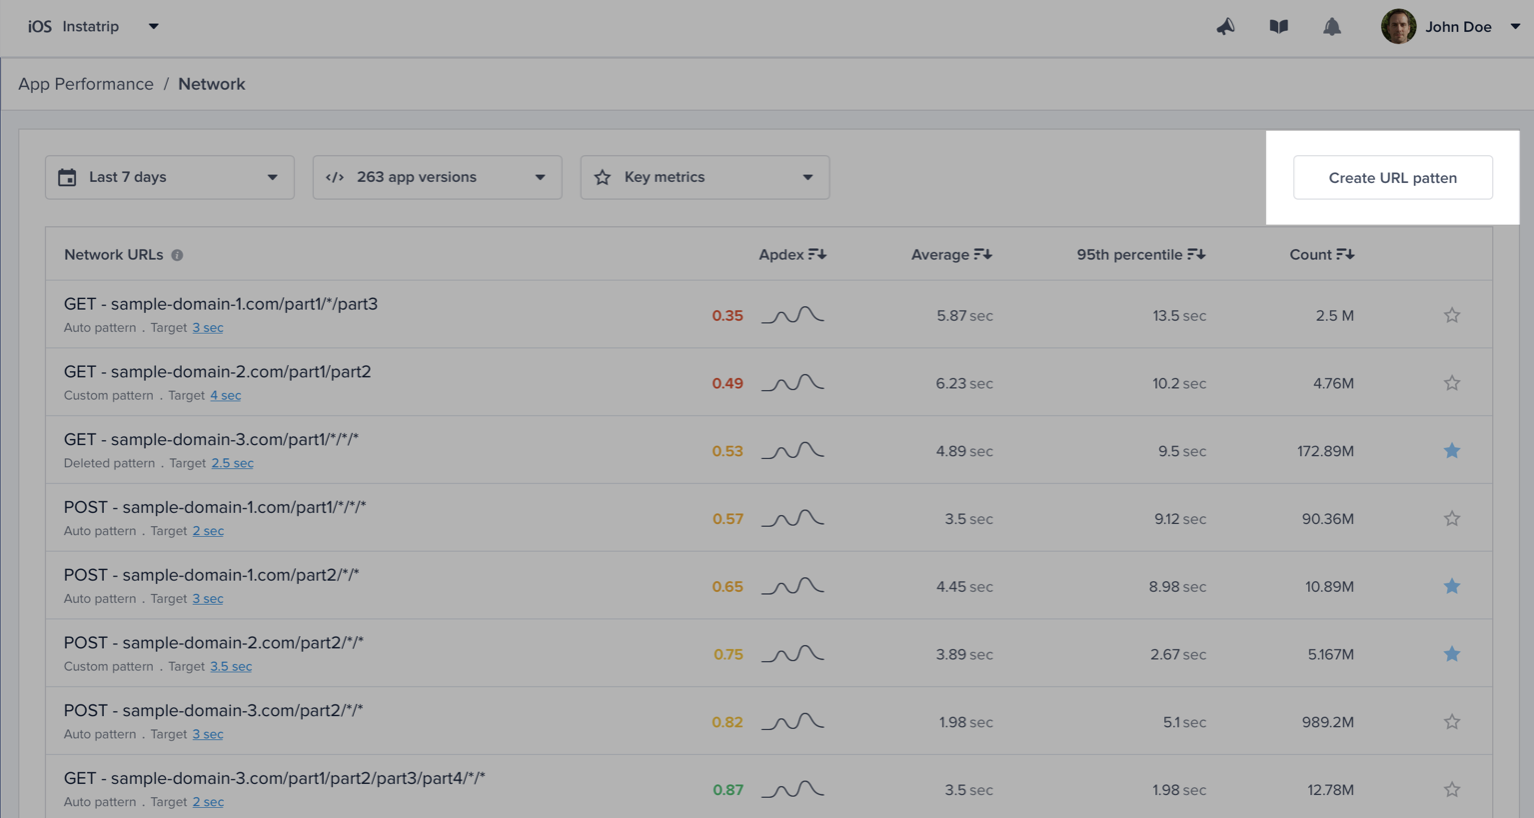
| URL pattern example | Matches with | Doesn't match with |
|---|---|---|
sample.com/part1/part2 | sample.com/part1/part2 | sample.com/part1 |
sample.com/part1/* | sample.com/part1/part2 | sample.com/part1/part2/part3 |
sample.com/part1/*/part3 | sample.com/part1/part2/part3 | sample.com/part1/part3/part4 sample.com/part1/part2/part3/part4 |
sample.com/part1/*/*/part4 | sample.com/part1/part2/part3/part4 | sample.com/part1/part2/part4 sample.com/part1/part2/part3/part4/part5 |
sample.com/part1/*/*/* | sample.com/part1/part2/part3/part4 | sample.com/part1/part2/part3/part4/part5 sample.com/part1/part2/part3 |
sample.com/part1/**/part5 | sample.com/part1/part2/part3/part4/part5 | sample.com/part1/part2/part3/part4/part8 |

Admin and Owner Roles
Member and Viewer Roles
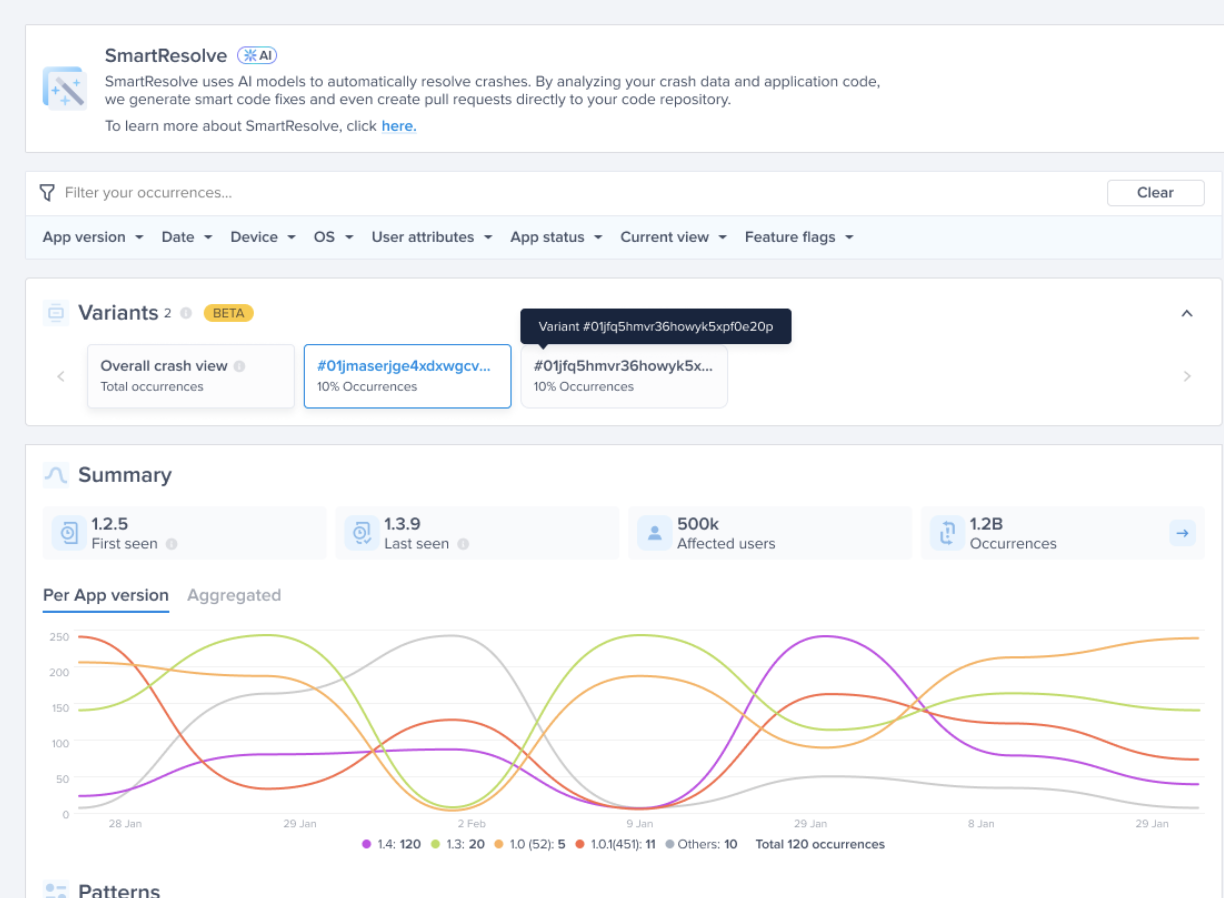
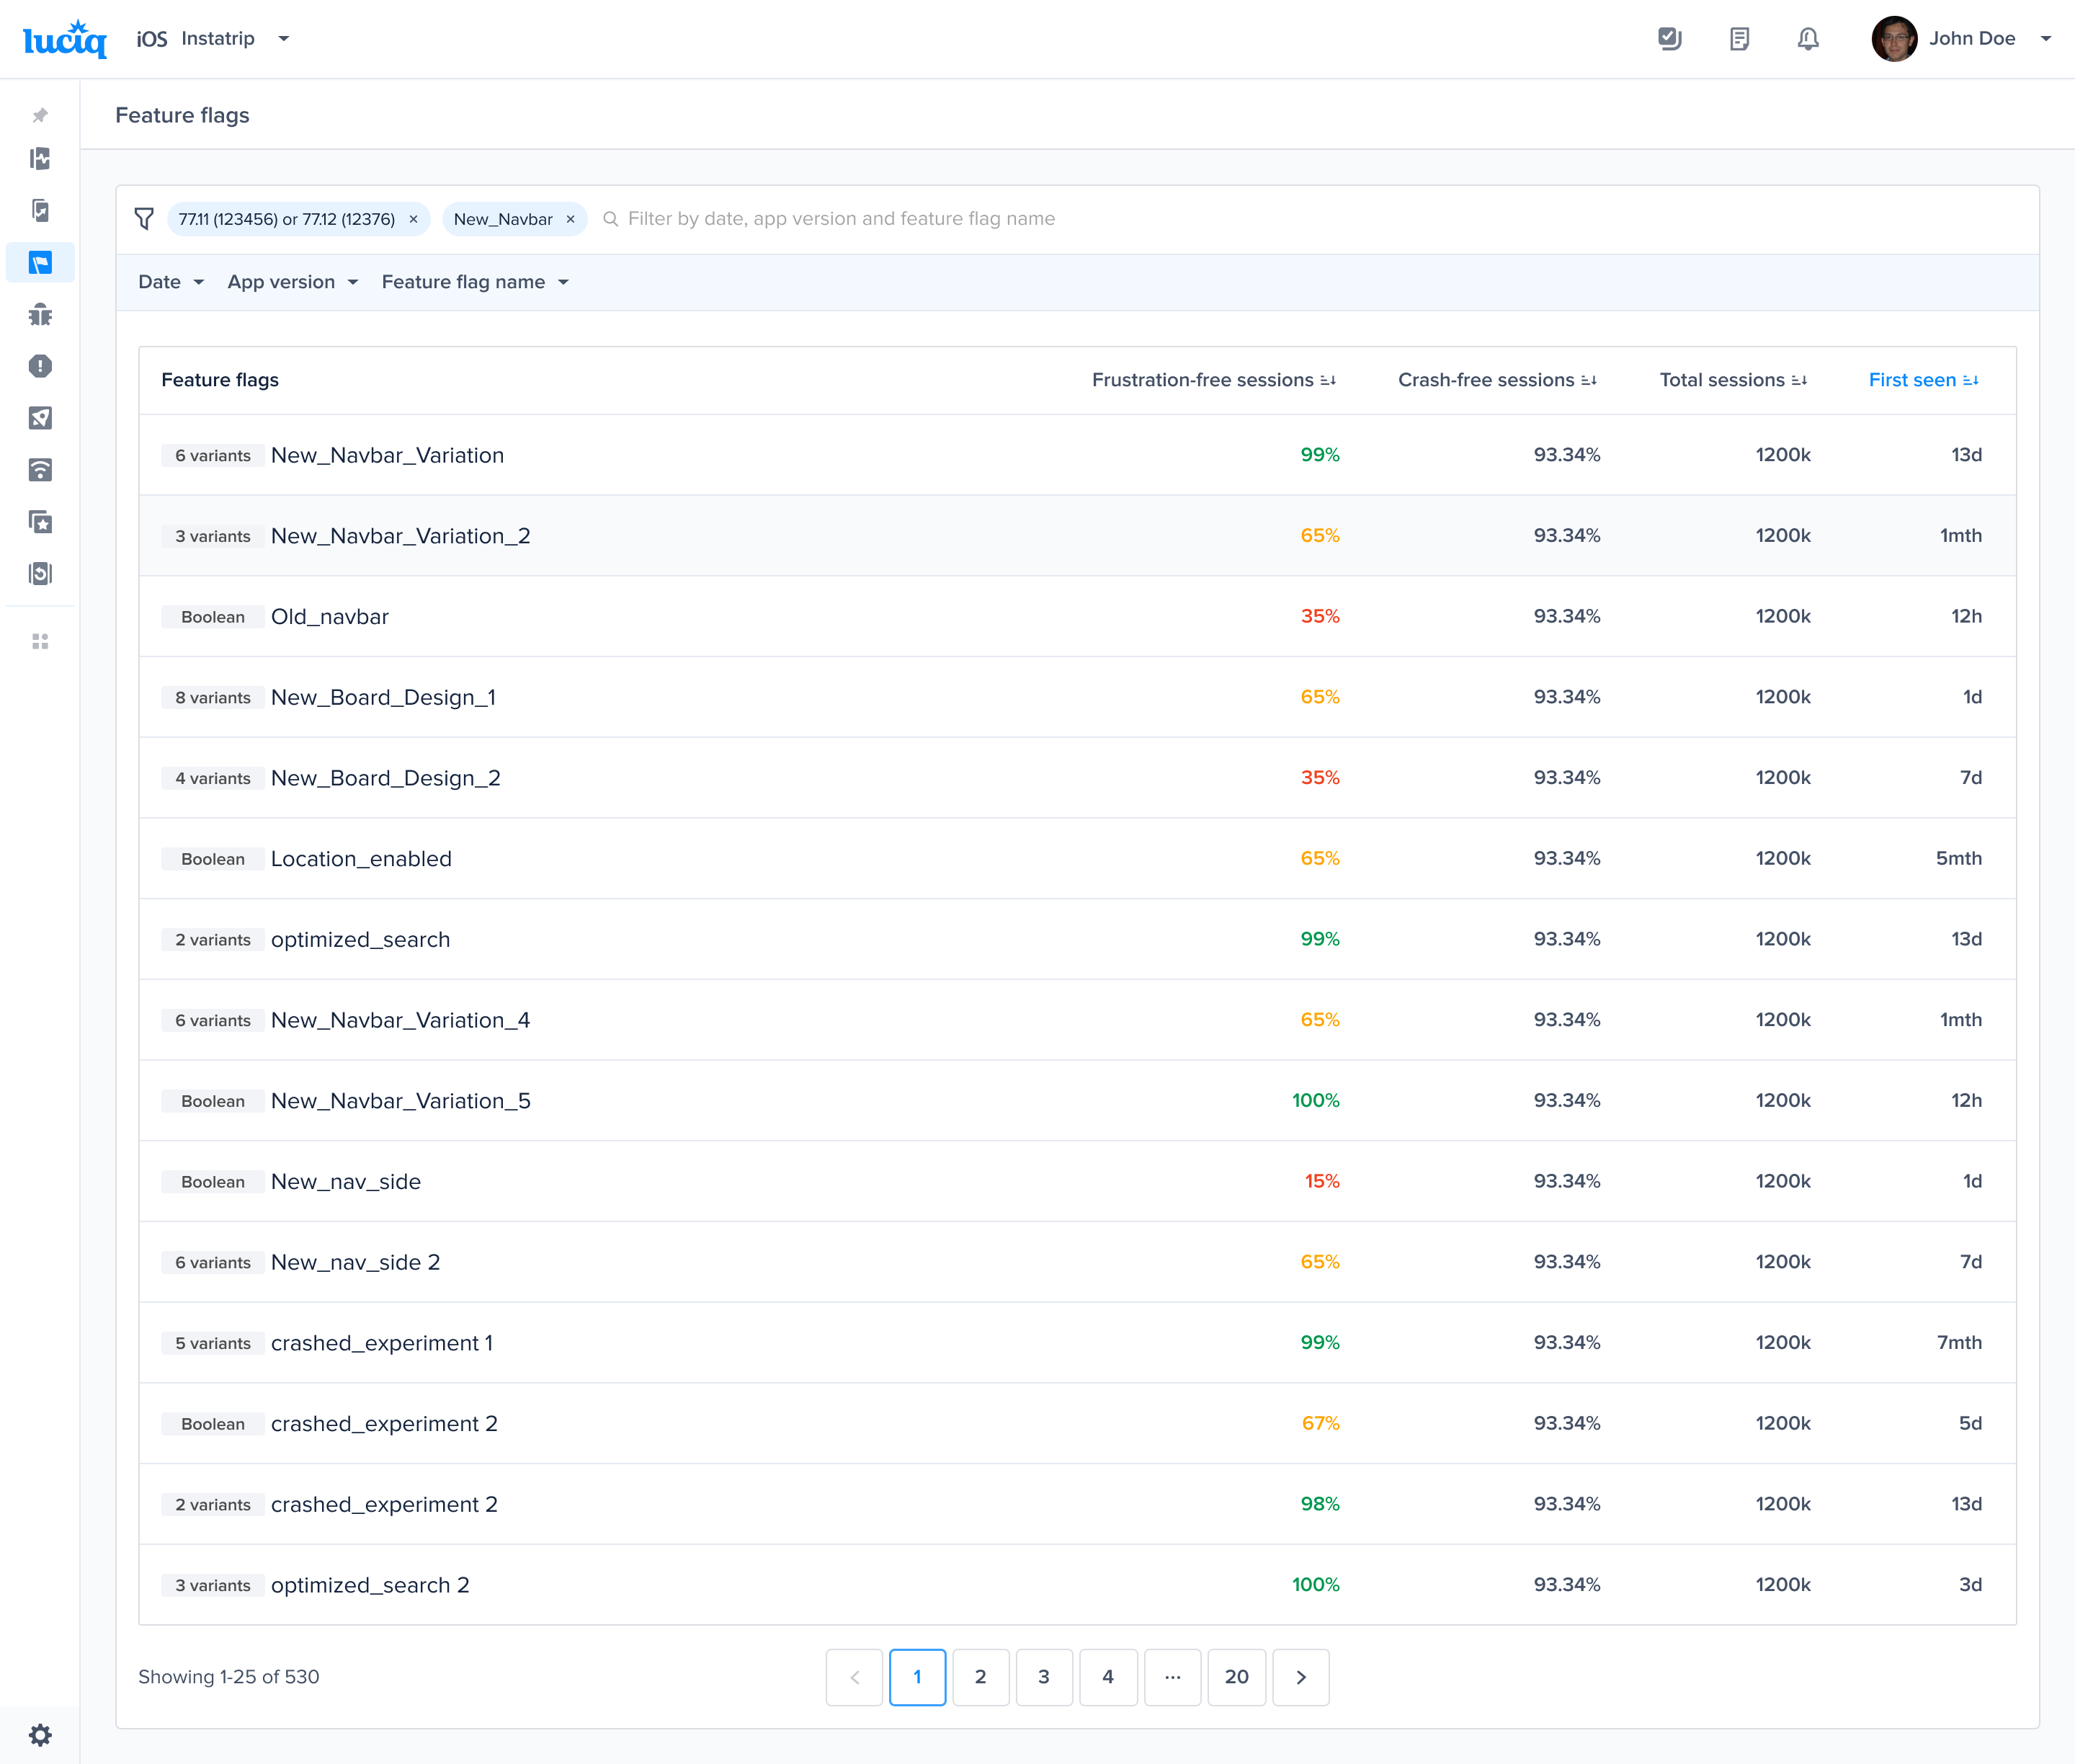
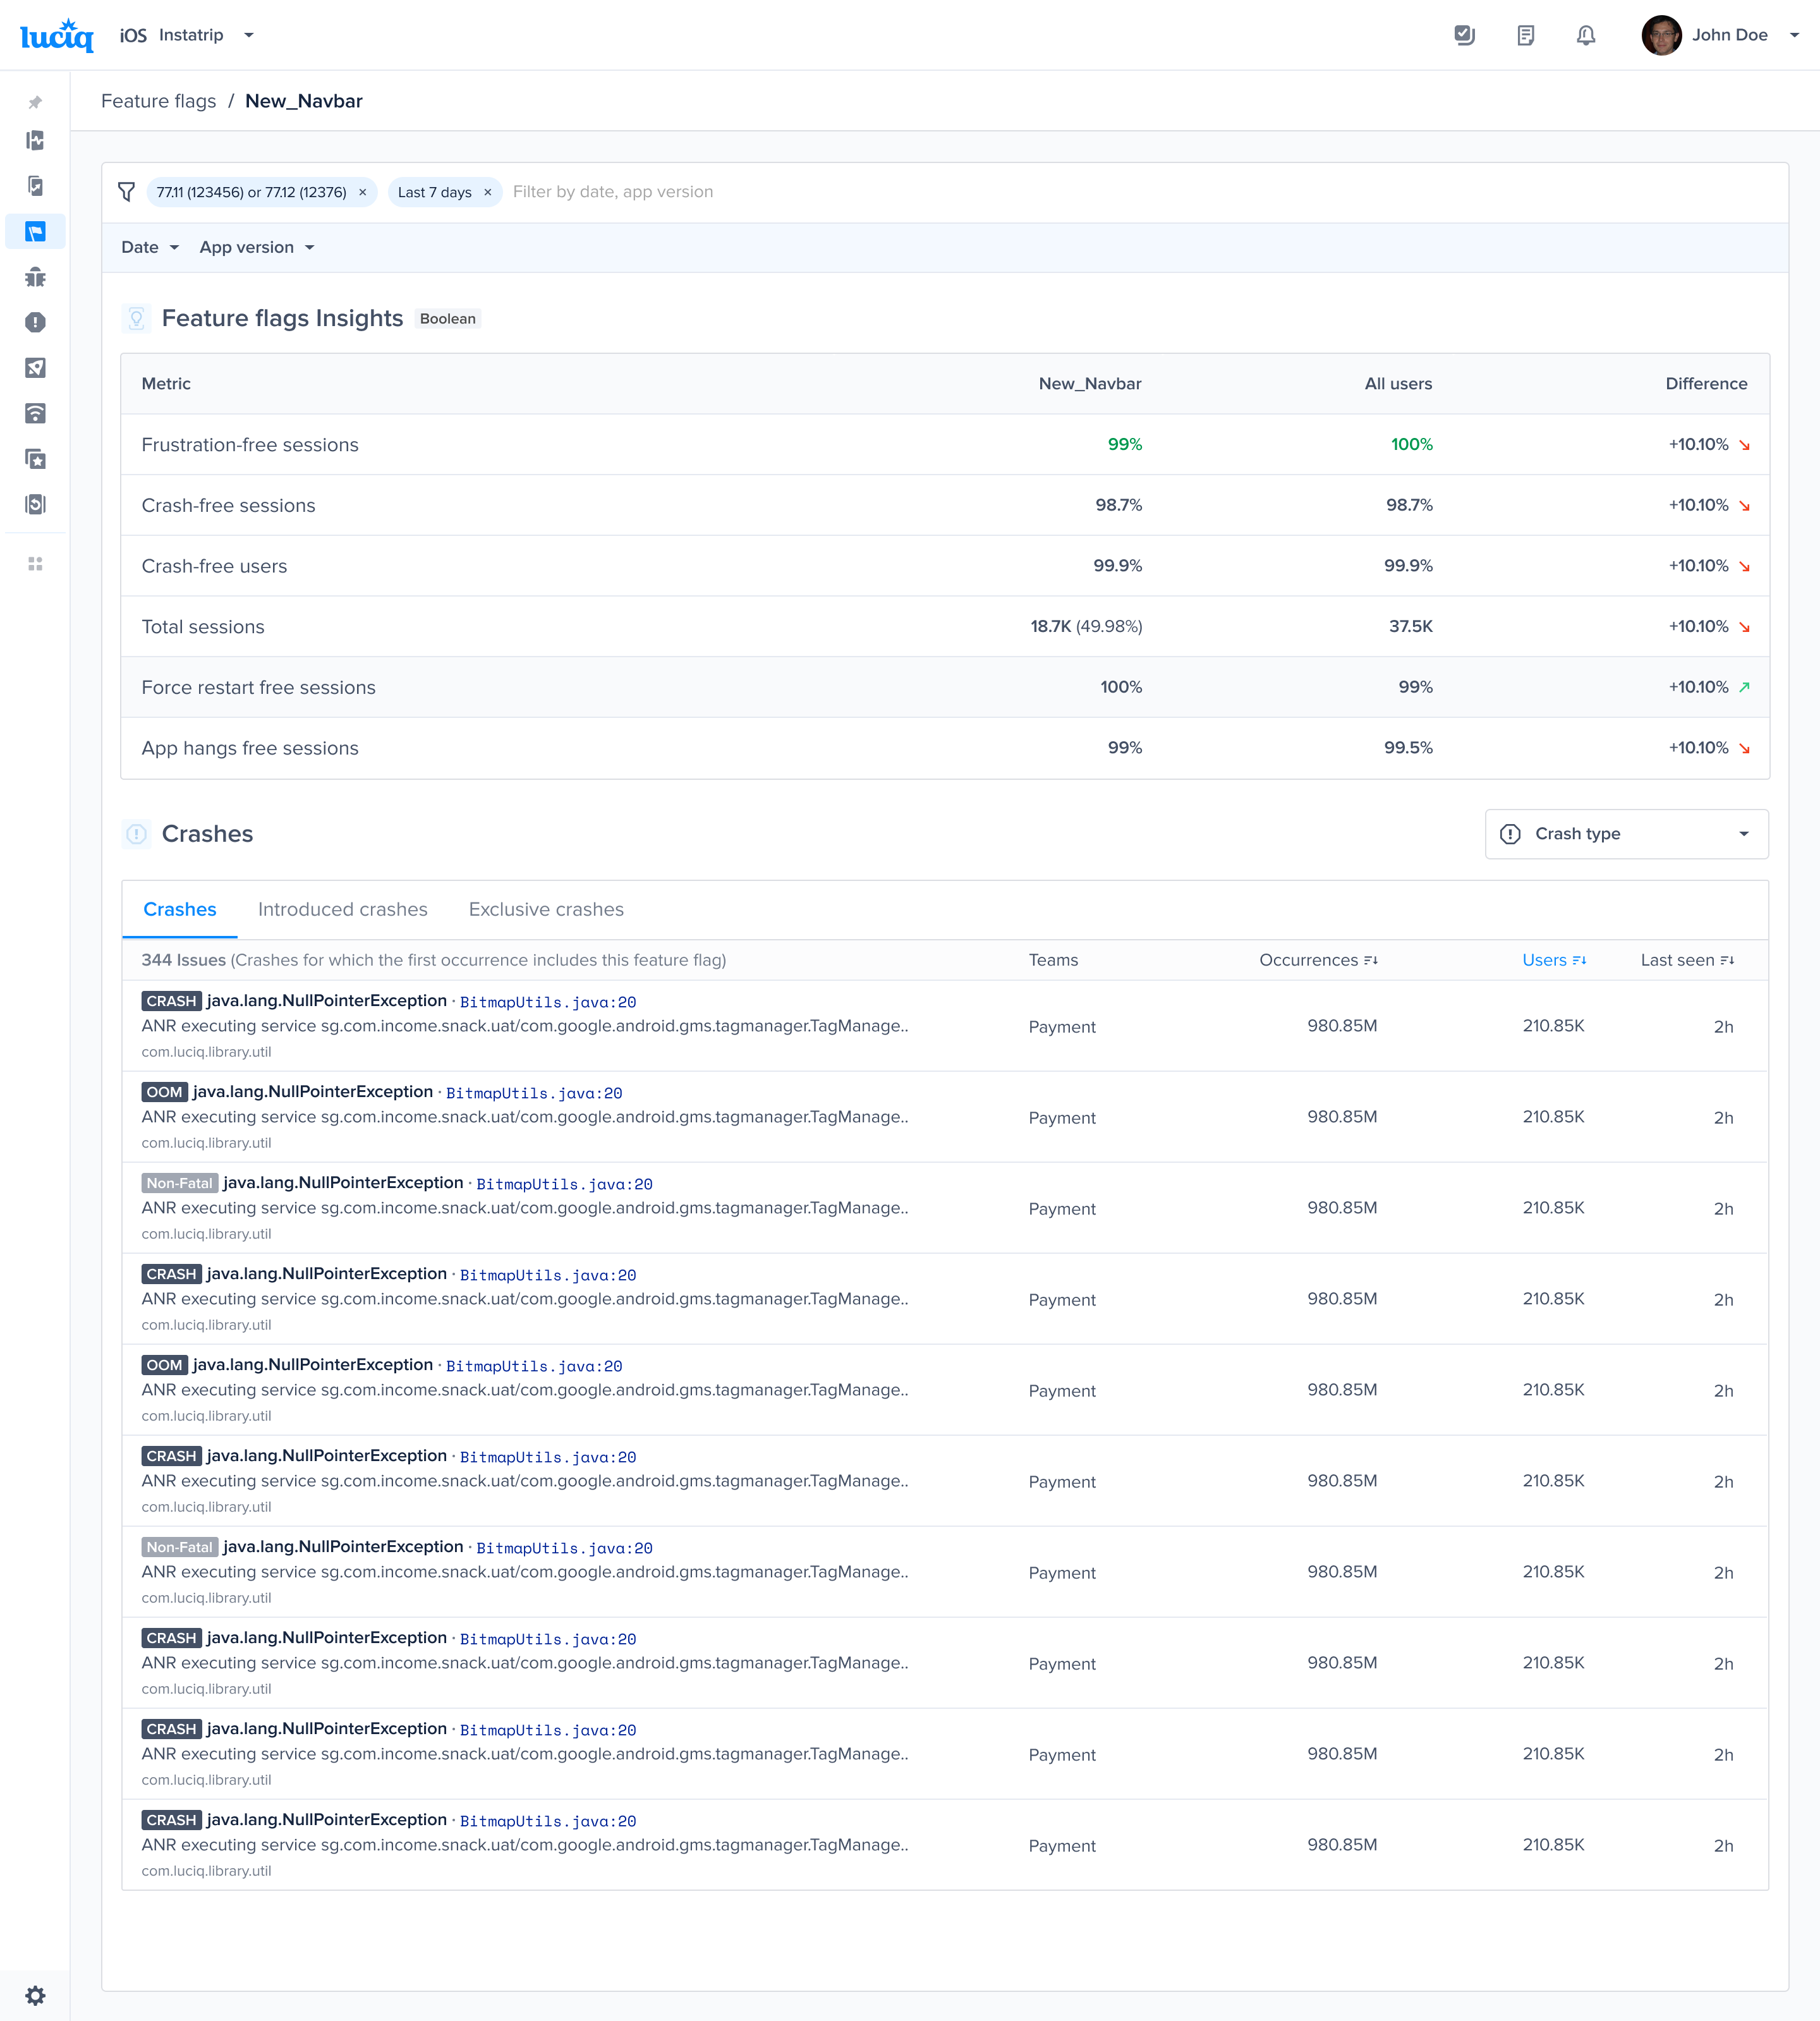
 #### Types of Feature Flags
There are two types of feature flags:
* **Boolean**: a feature flag that has no variants. Usually used in kill switch feature flags.
* **Multivariant**: a feature flag with multiple variants.
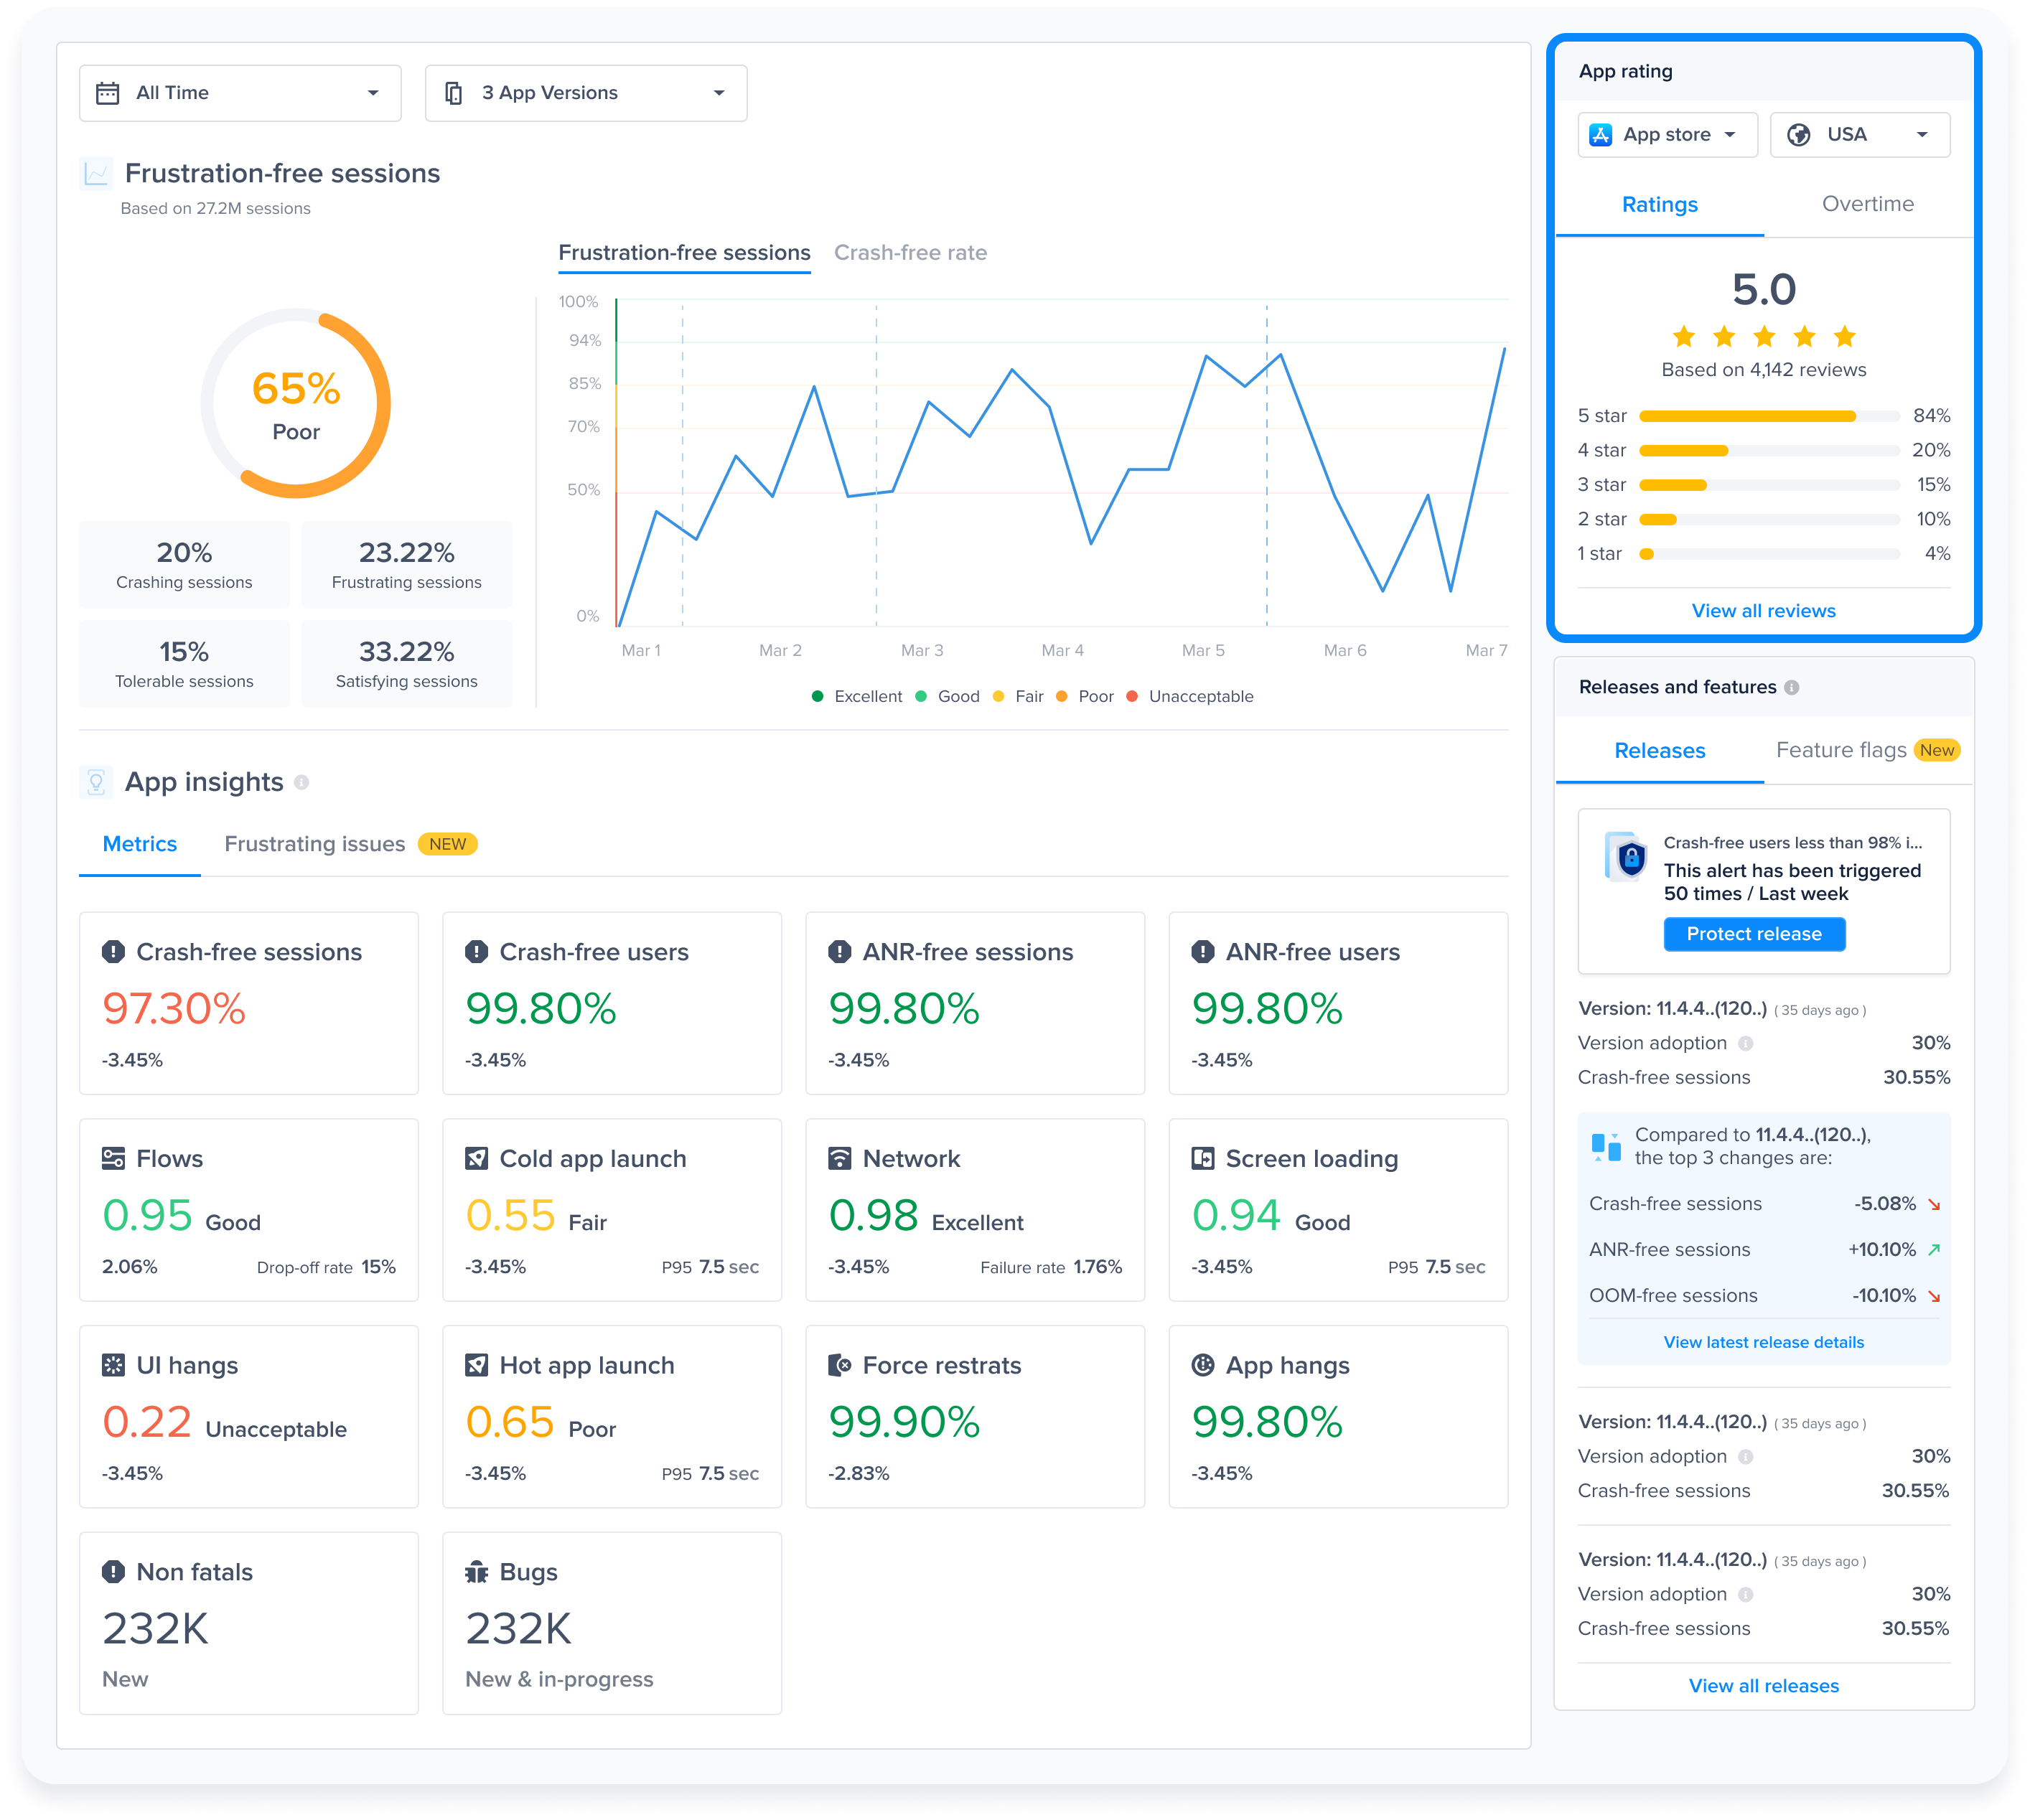
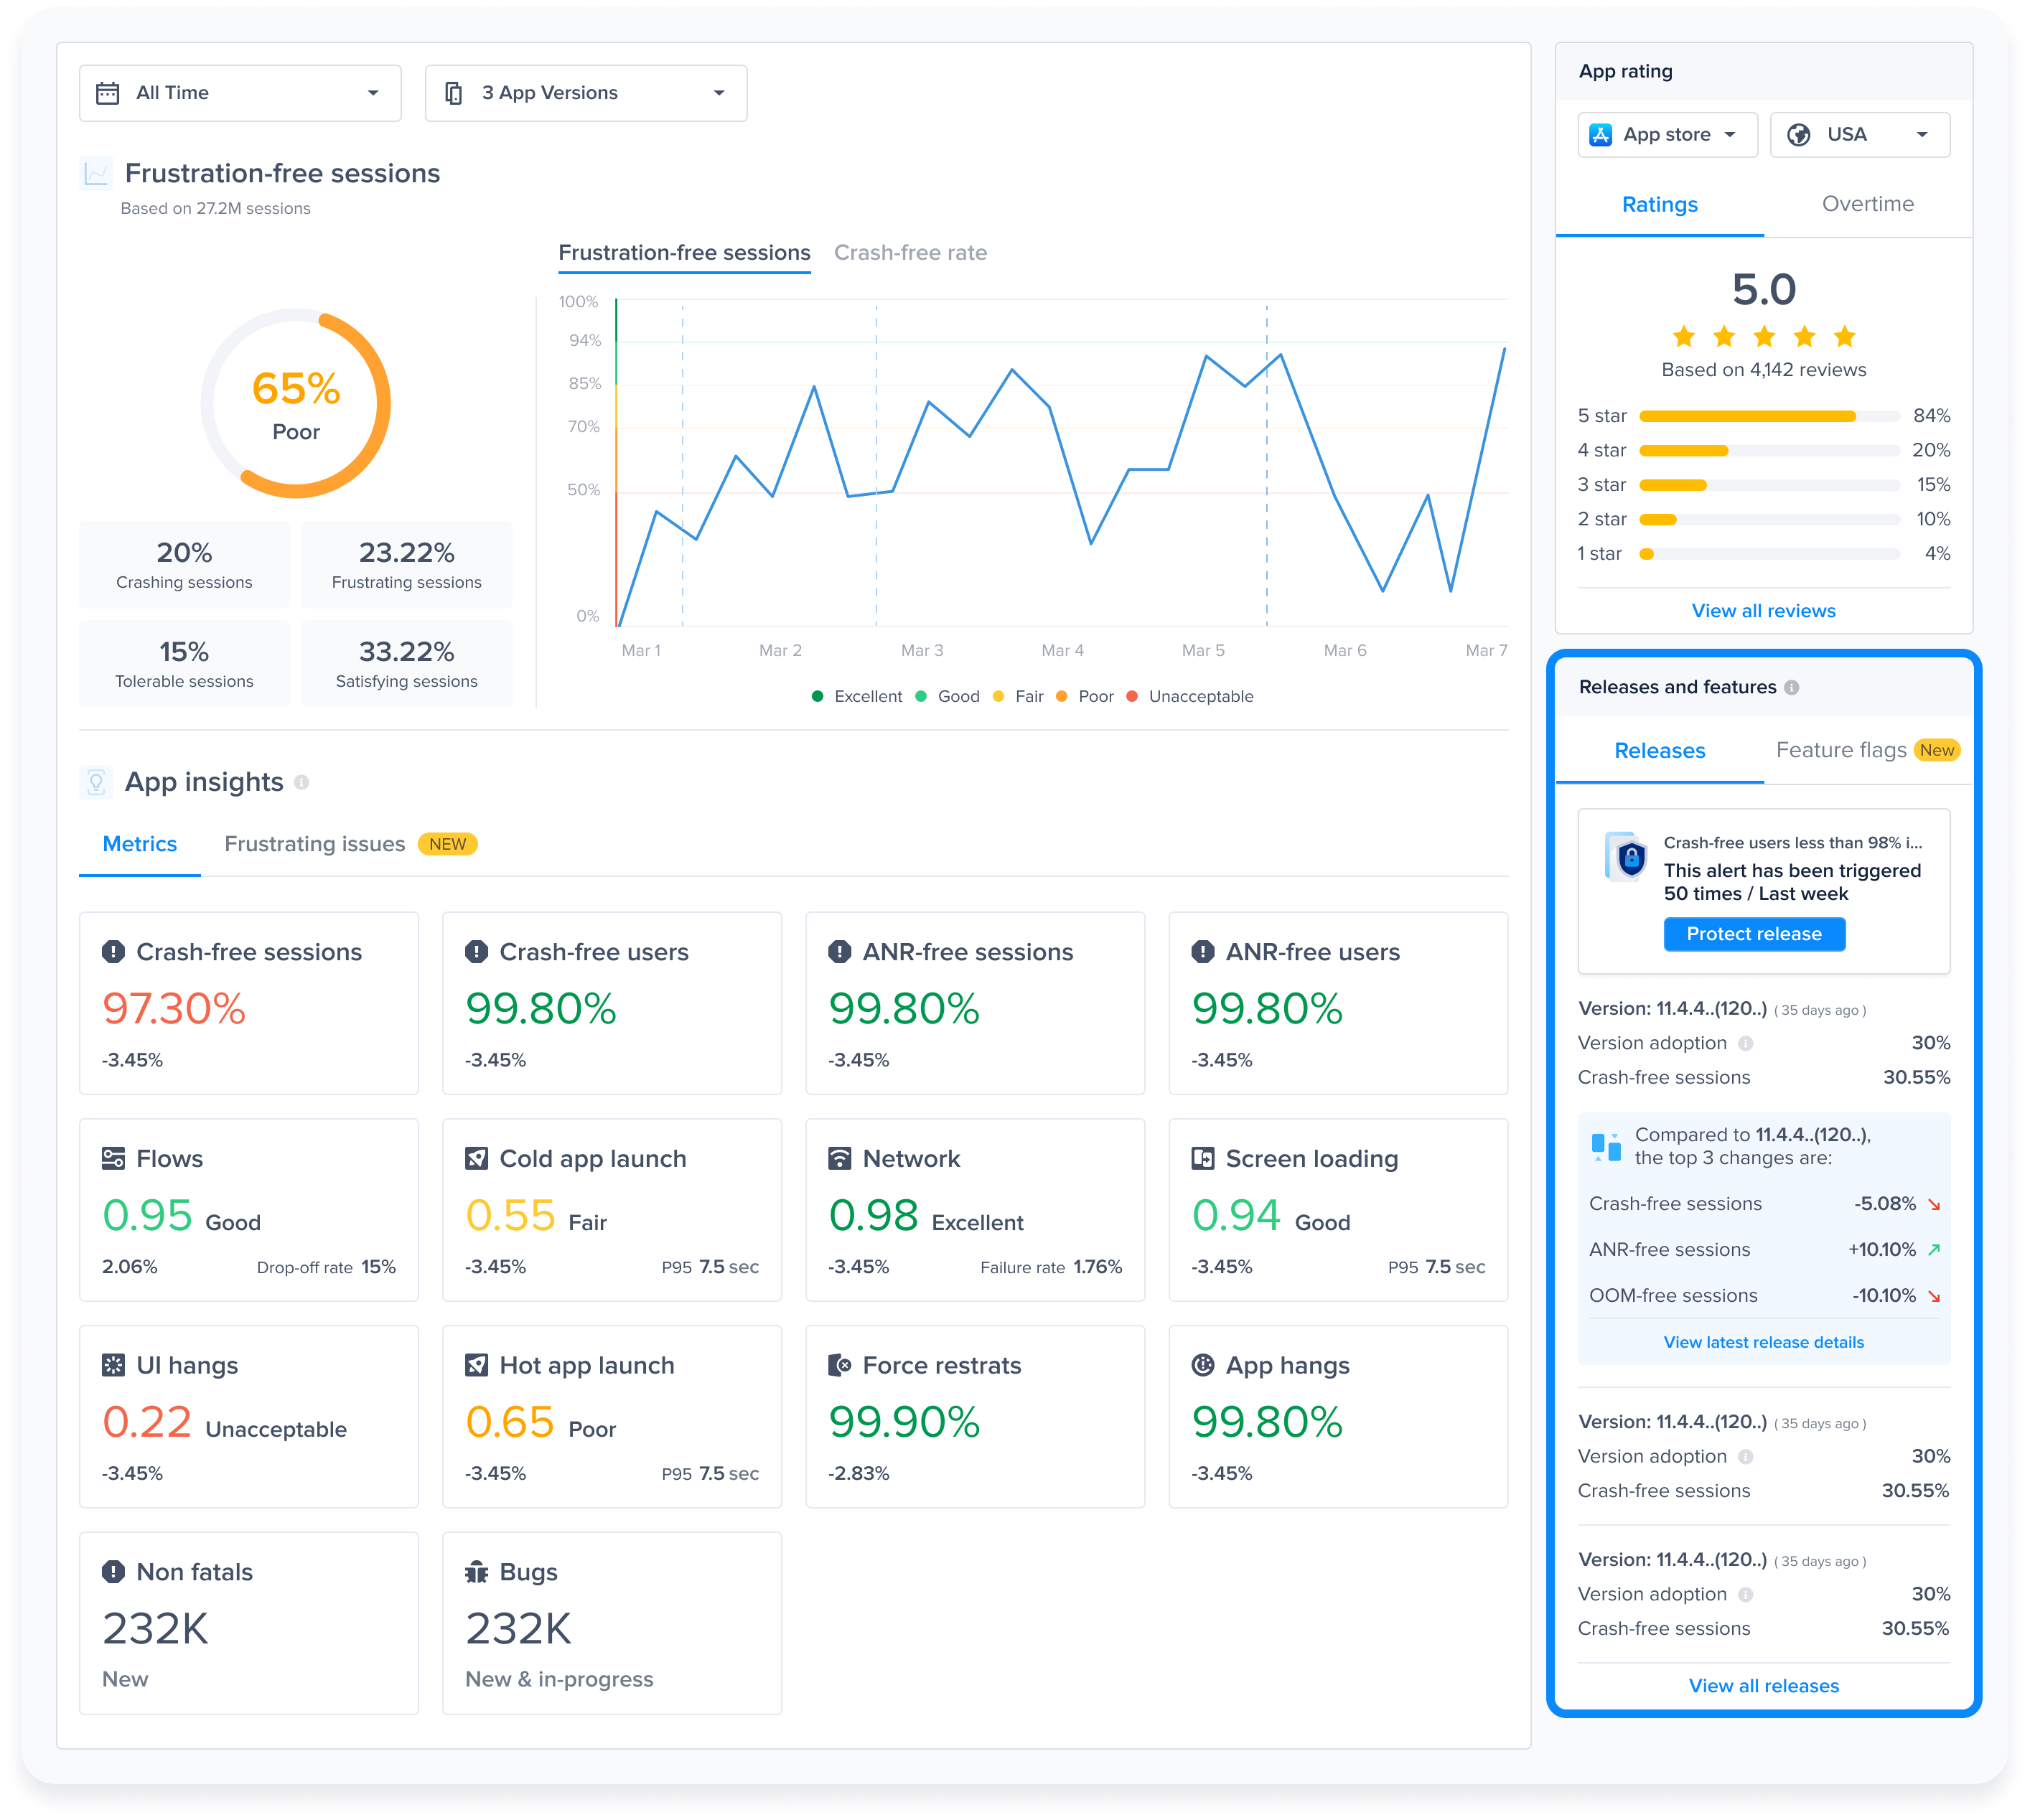
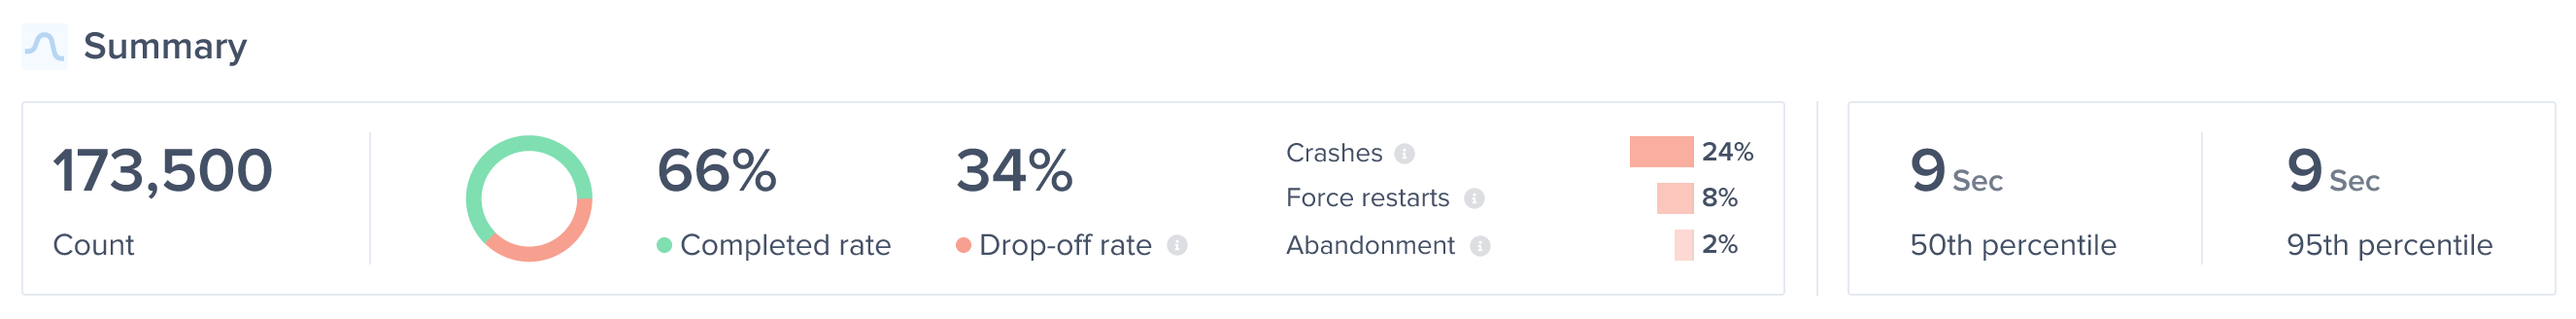
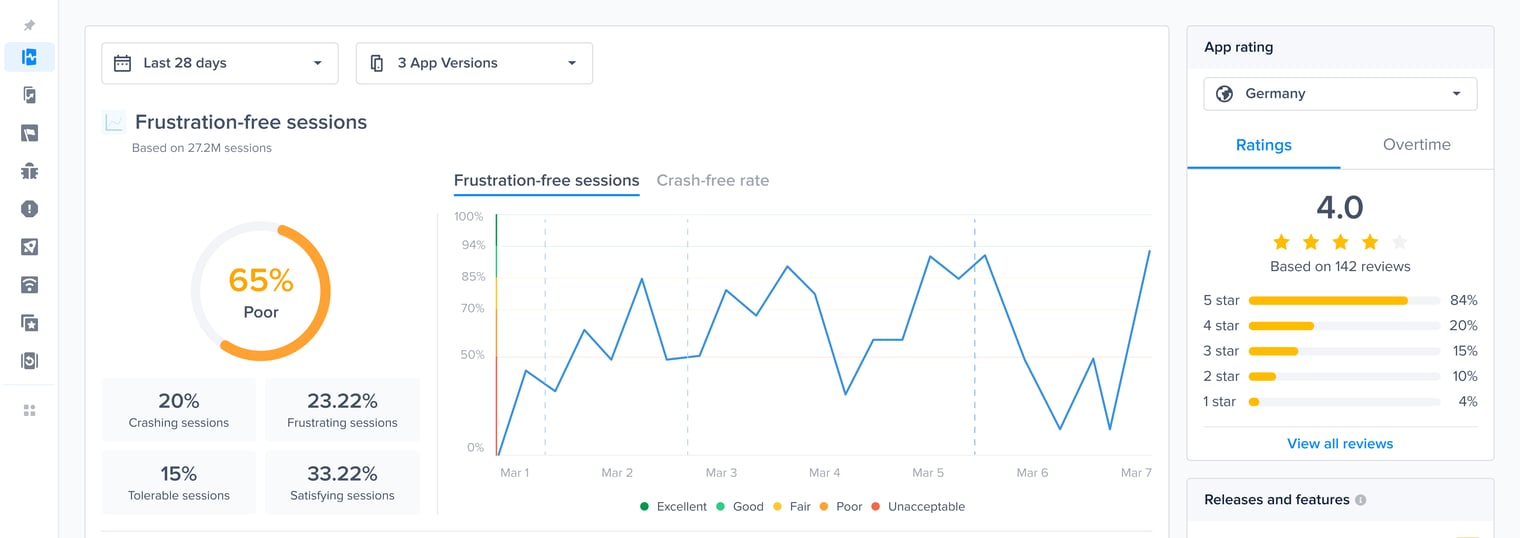
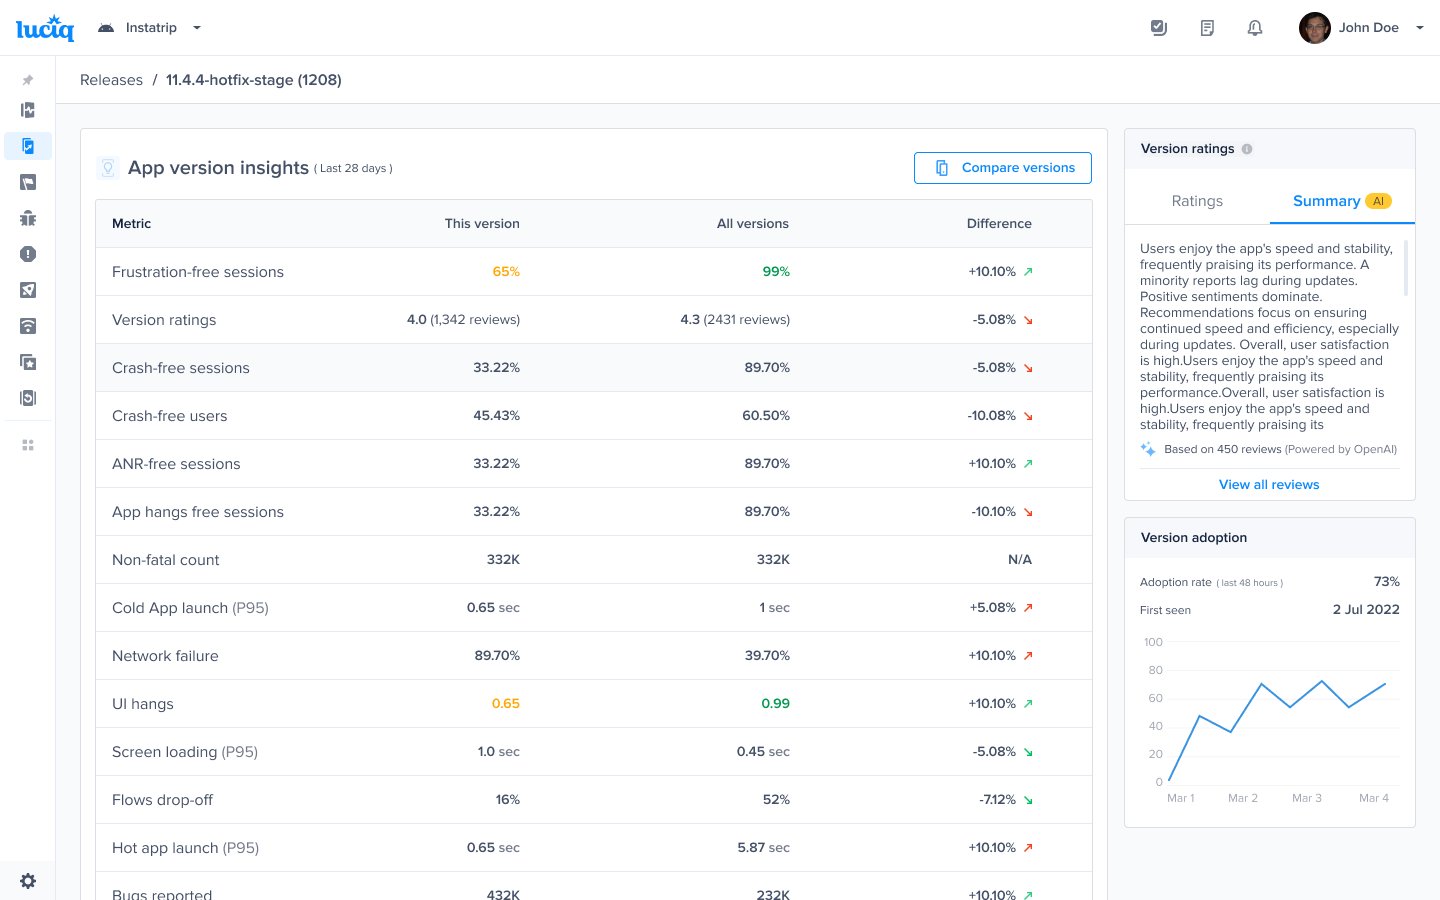
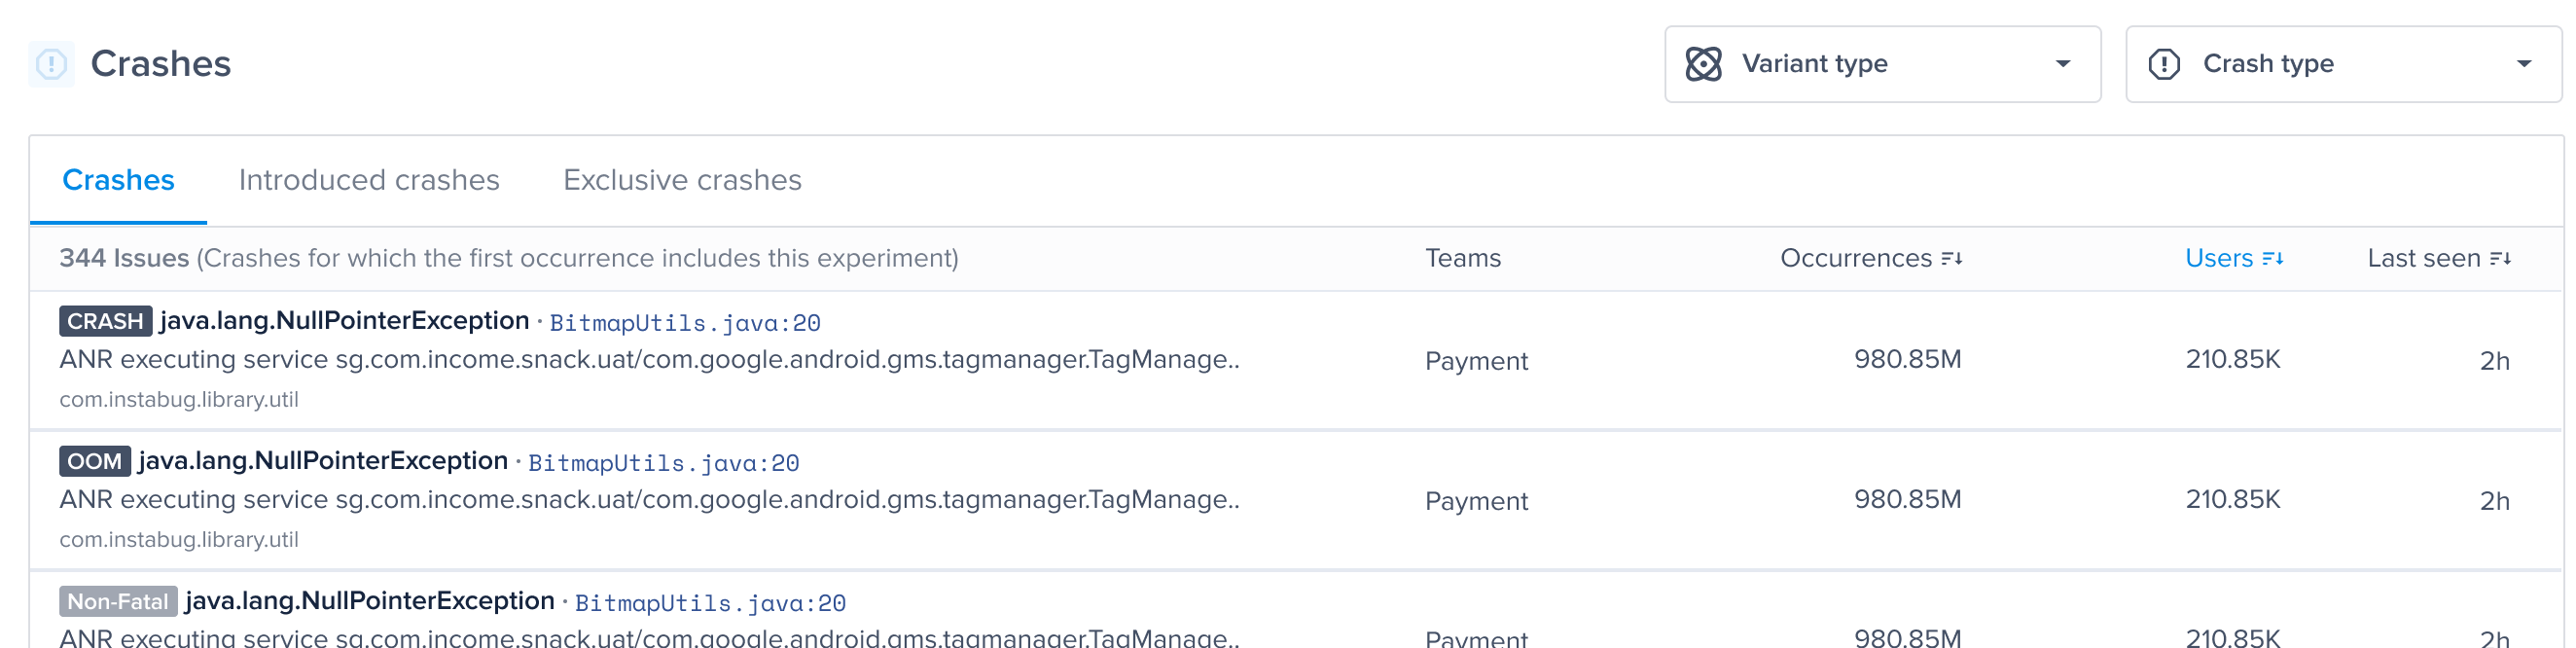
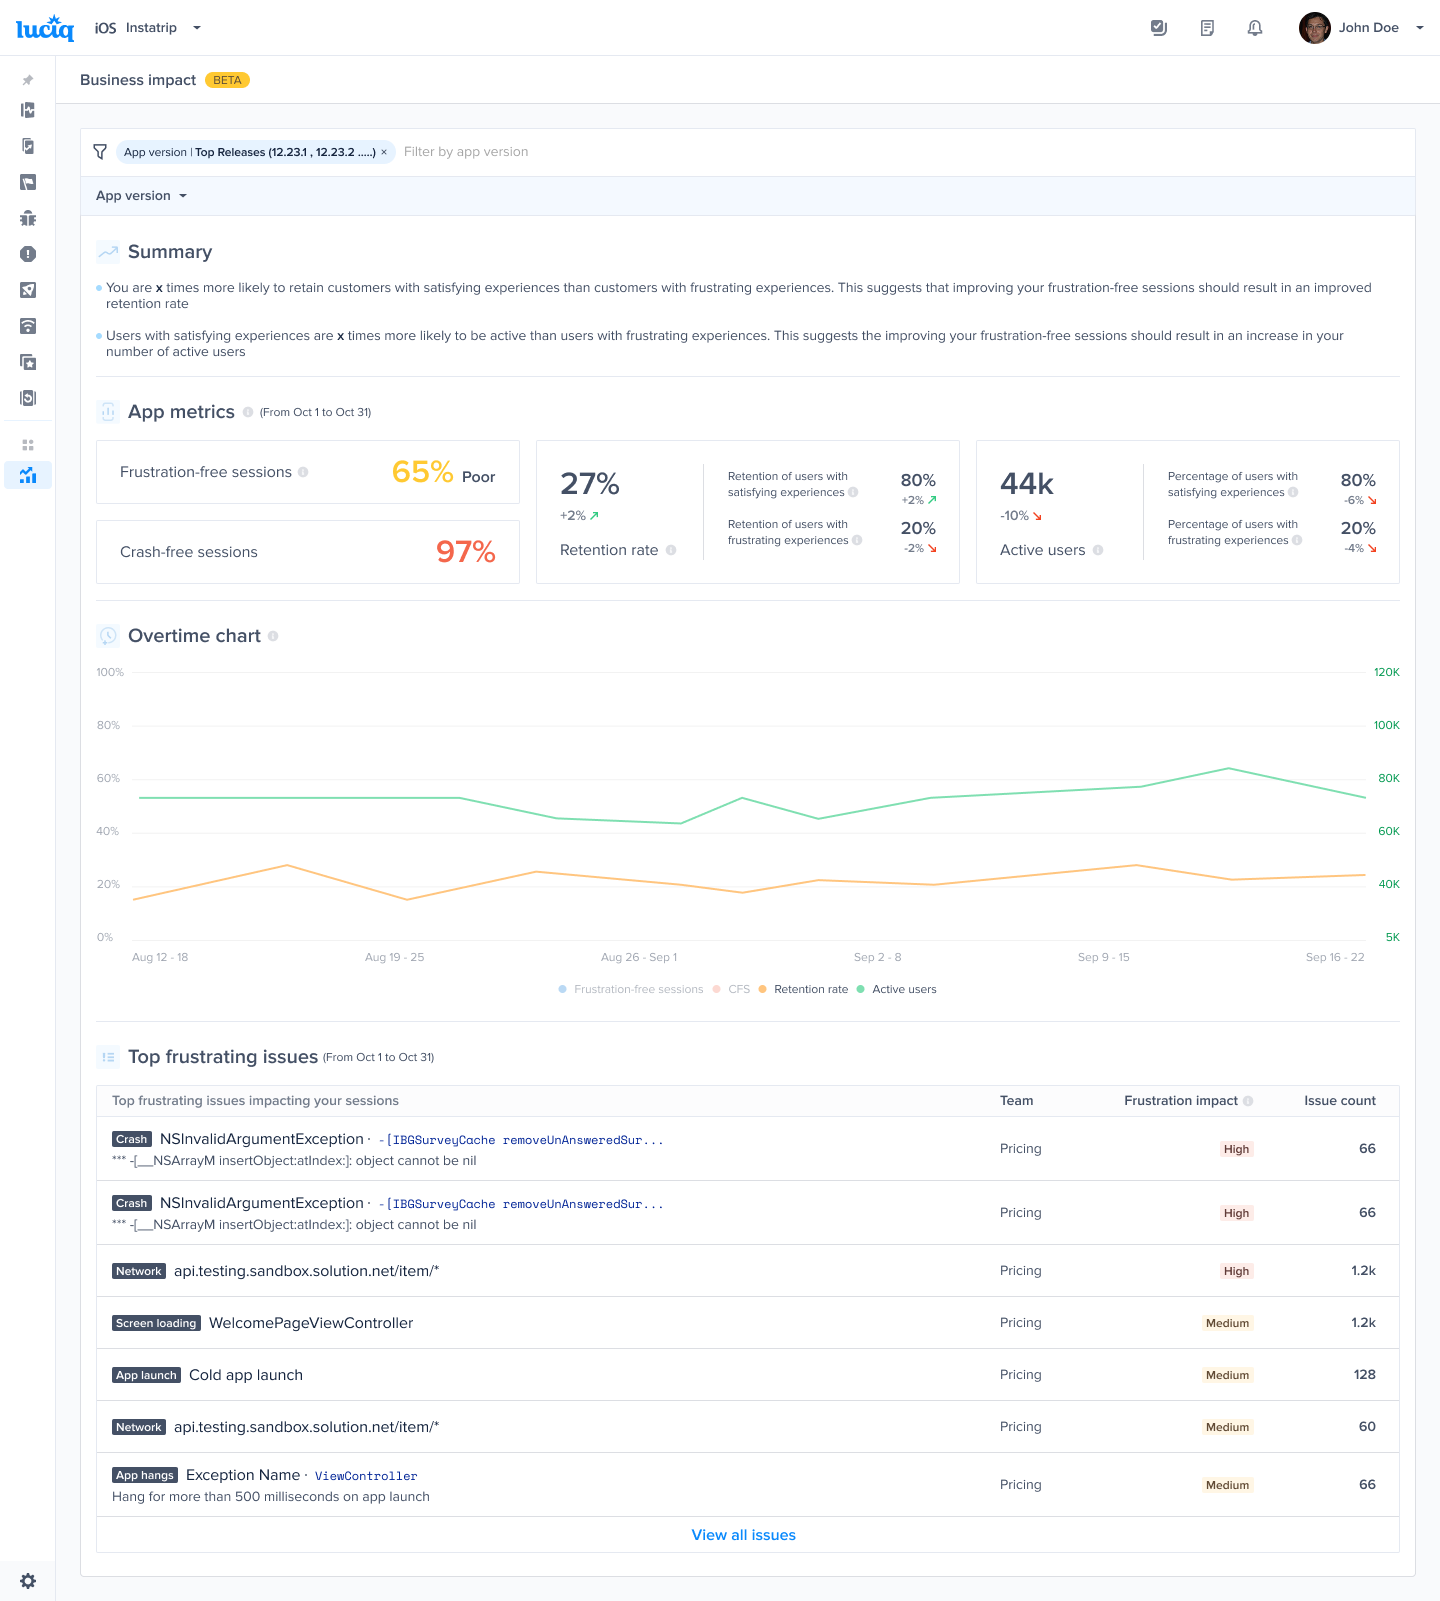
#### Gain key insights
You are able to view different metrics within the page that allow you to gain more key insights like:
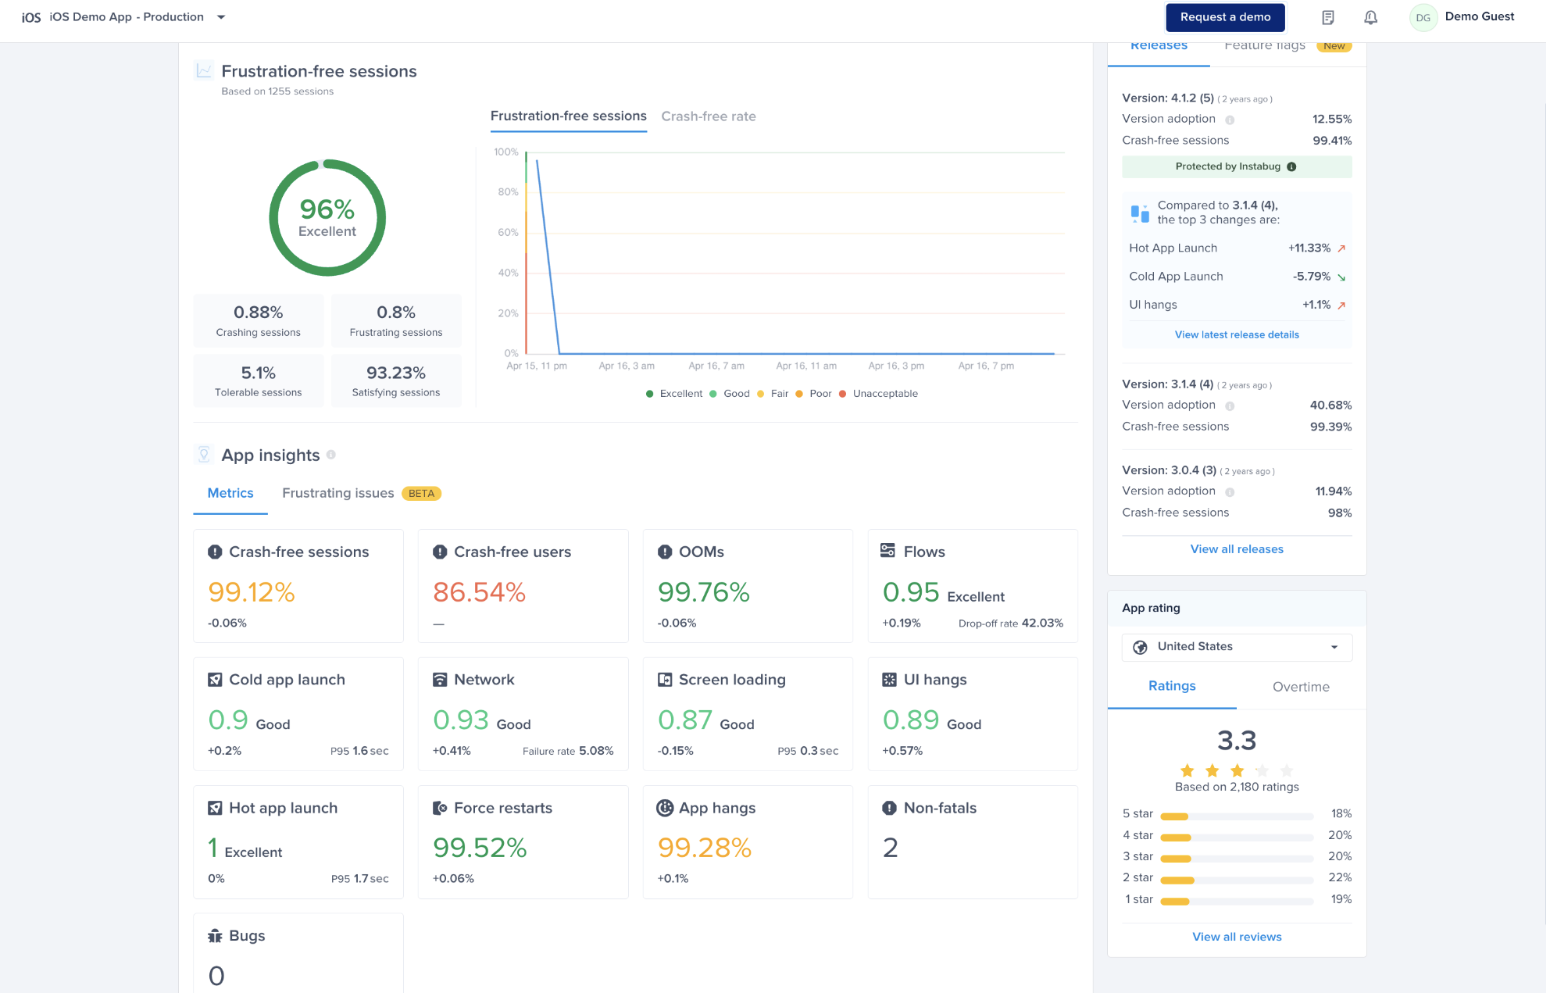
* **Apdex Score:** An overall Apdex score is calculated based on Crashes, App Hangs, and Force Restarts occurring in sessions with this feature.
* **Crash-Free Users Rate:** The percentage of users experiencing this feature without any crashes, relative to the total number of users using this feature.
* **Crash-Free Sessions Rate:** The percentage of sessions with this feature that are crash-free out of the total sessions involving this feature.
* **Total Sessions:** View the total number of sessions where this feature flag was detected, providing an overview of its usage.
* **First Seen**: Sort by and view the dates of the release of your feature flags.
#### Types of Feature Flags
There are two types of feature flags:
* **Boolean**: a feature flag that has no variants. Usually used in kill switch feature flags.
* **Multivariant**: a feature flag with multiple variants.
#### Gain key insights
You are able to view different metrics within the page that allow you to gain more key insights like:
* **Apdex Score:** An overall Apdex score is calculated based on Crashes, App Hangs, and Force Restarts occurring in sessions with this feature.
* **Crash-Free Users Rate:** The percentage of users experiencing this feature without any crashes, relative to the total number of users using this feature.
* **Crash-Free Sessions Rate:** The percentage of sessions with this feature that are crash-free out of the total sessions involving this feature.
* **Total Sessions:** View the total number of sessions where this feature flag was detected, providing an overview of its usage.
* **First Seen**: Sort by and view the dates of the release of your feature flags.

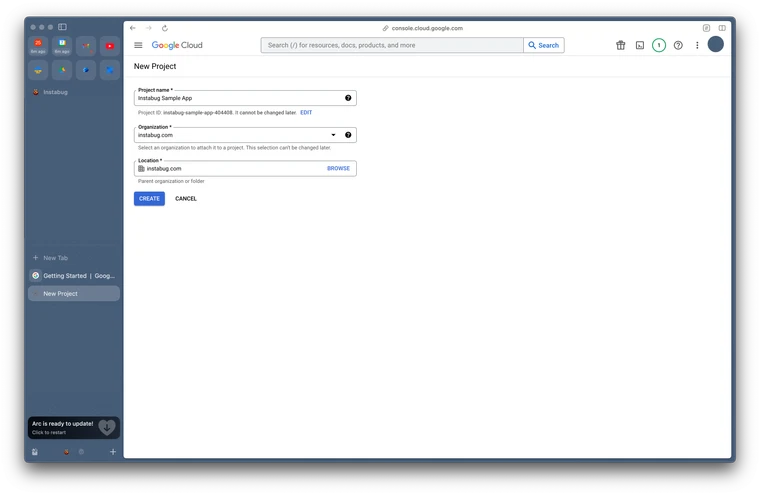
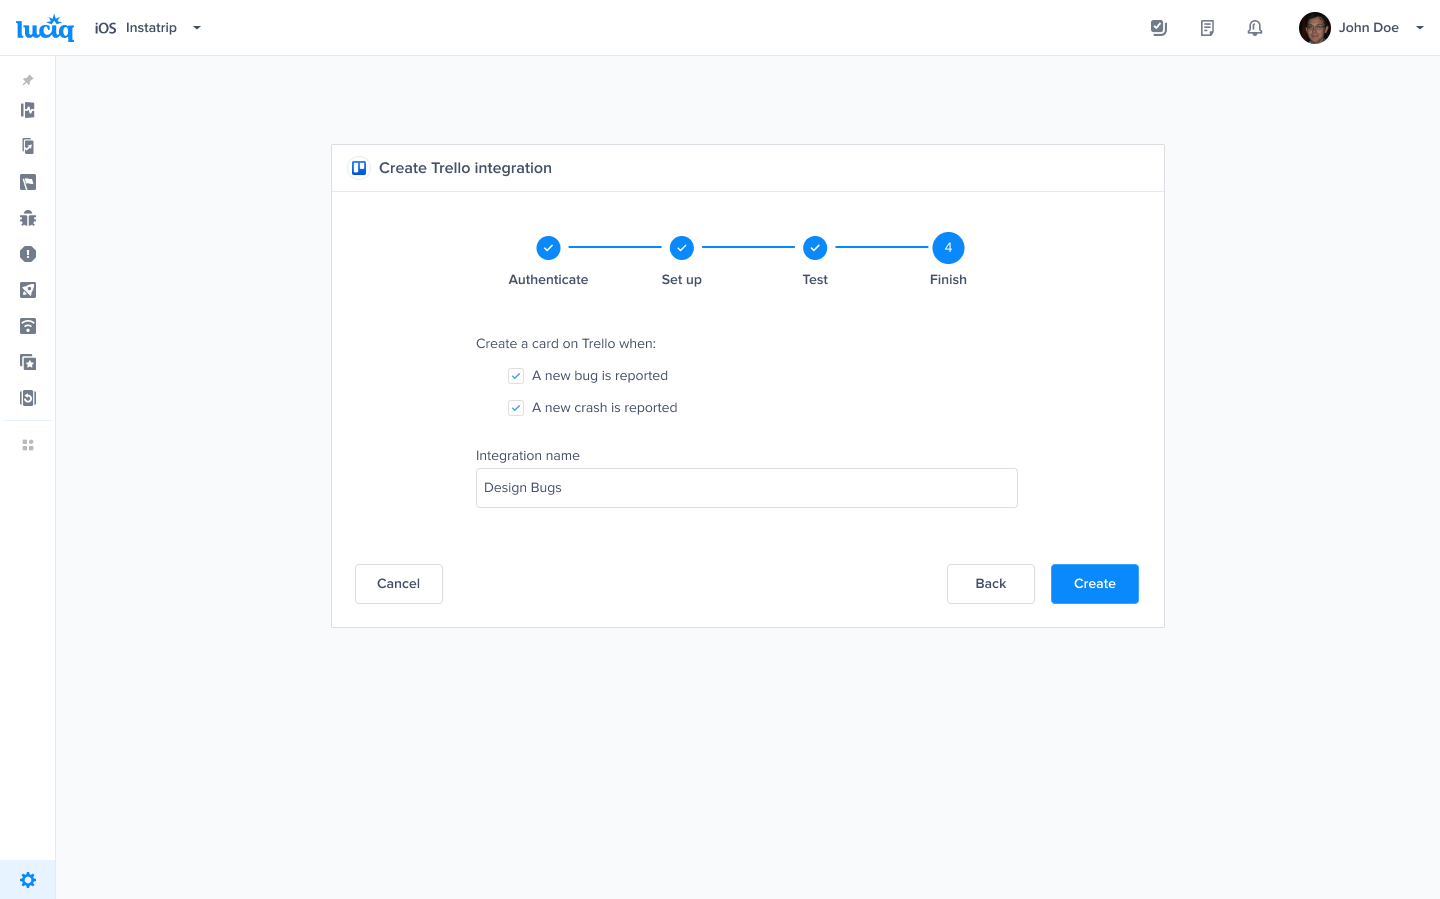
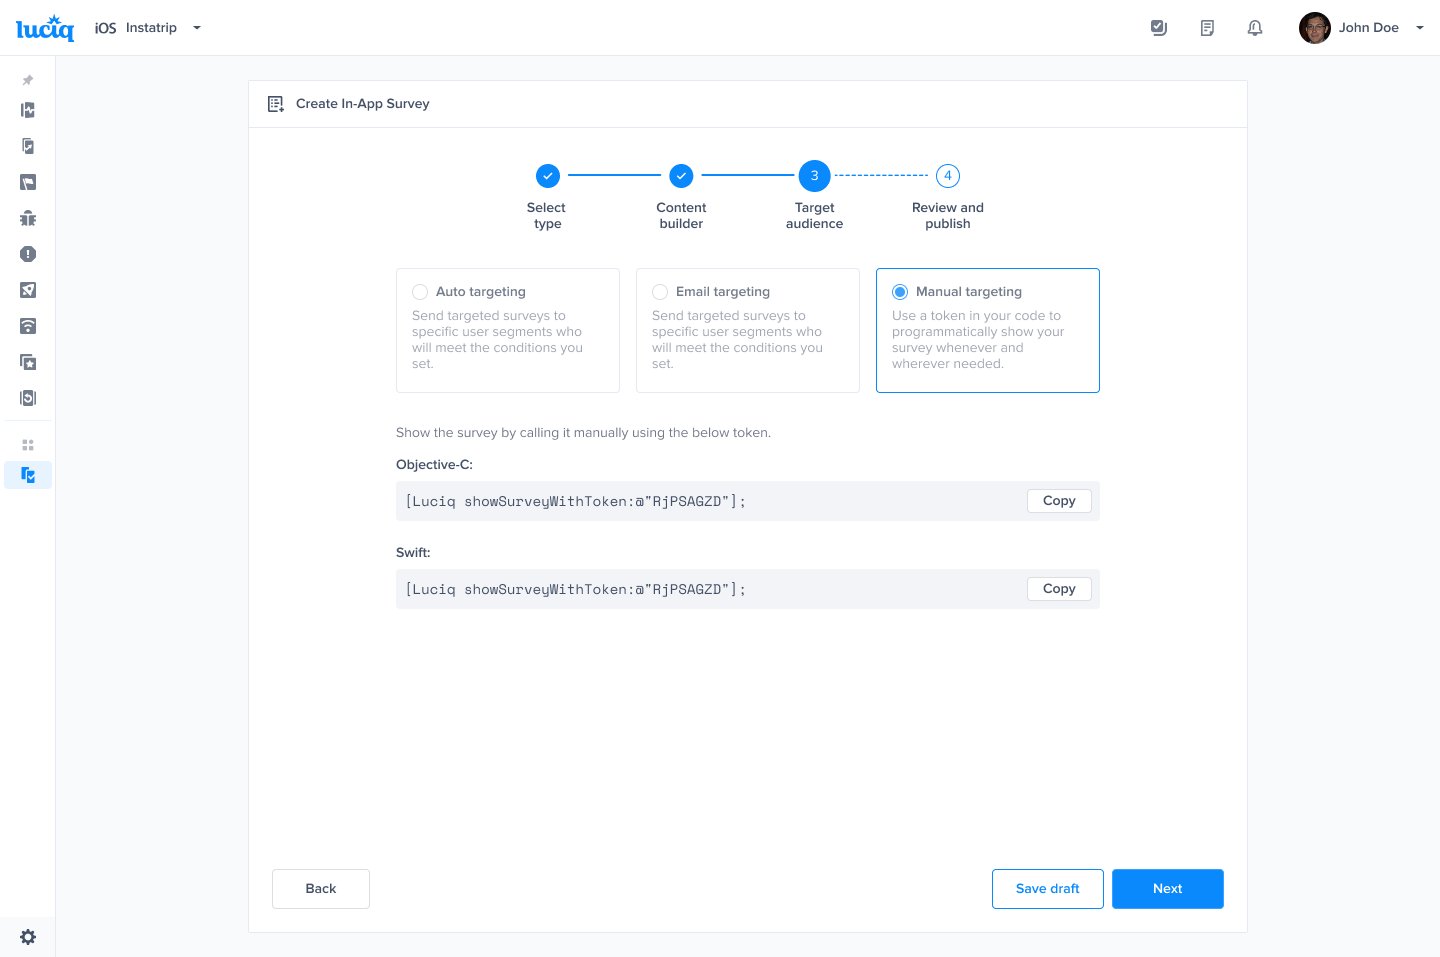
Replace YOUR\_APP\_TOKEN with your actual Luciq Application Token


.png)
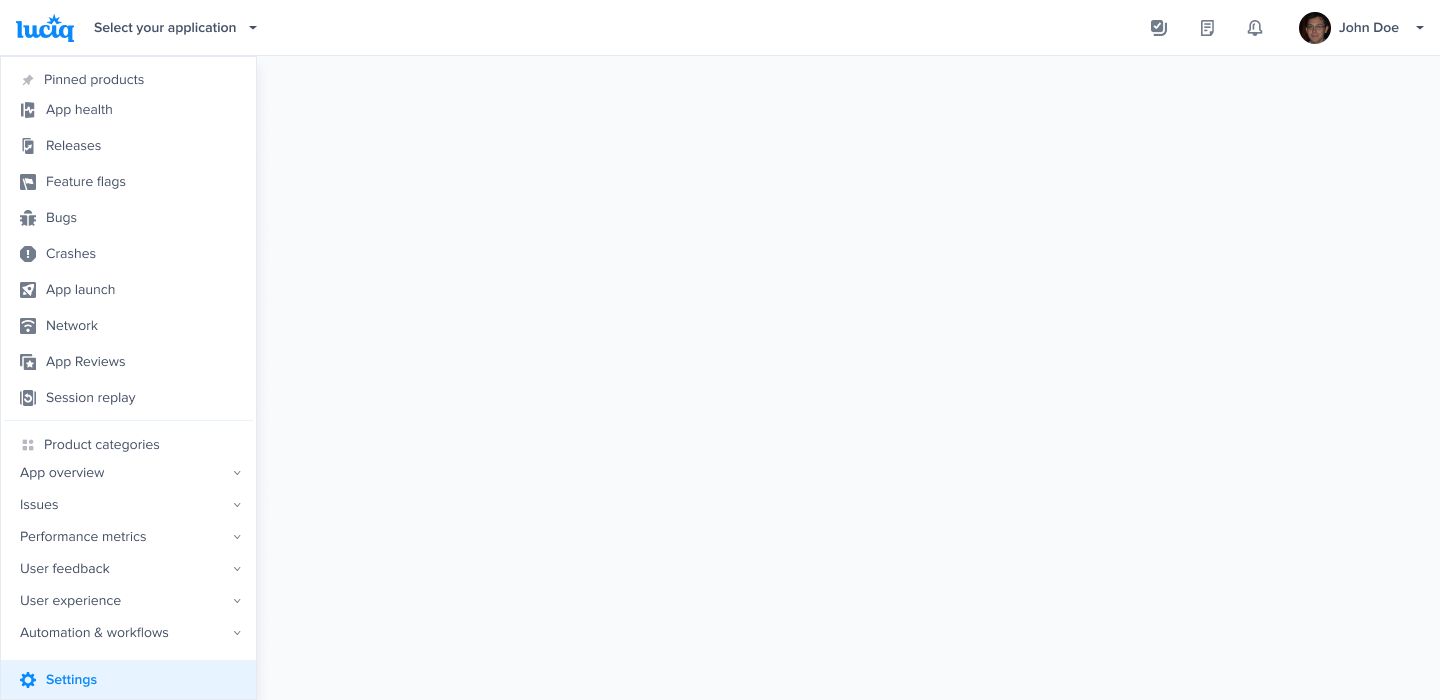
Settings Menu - Bottom left of the dashboard
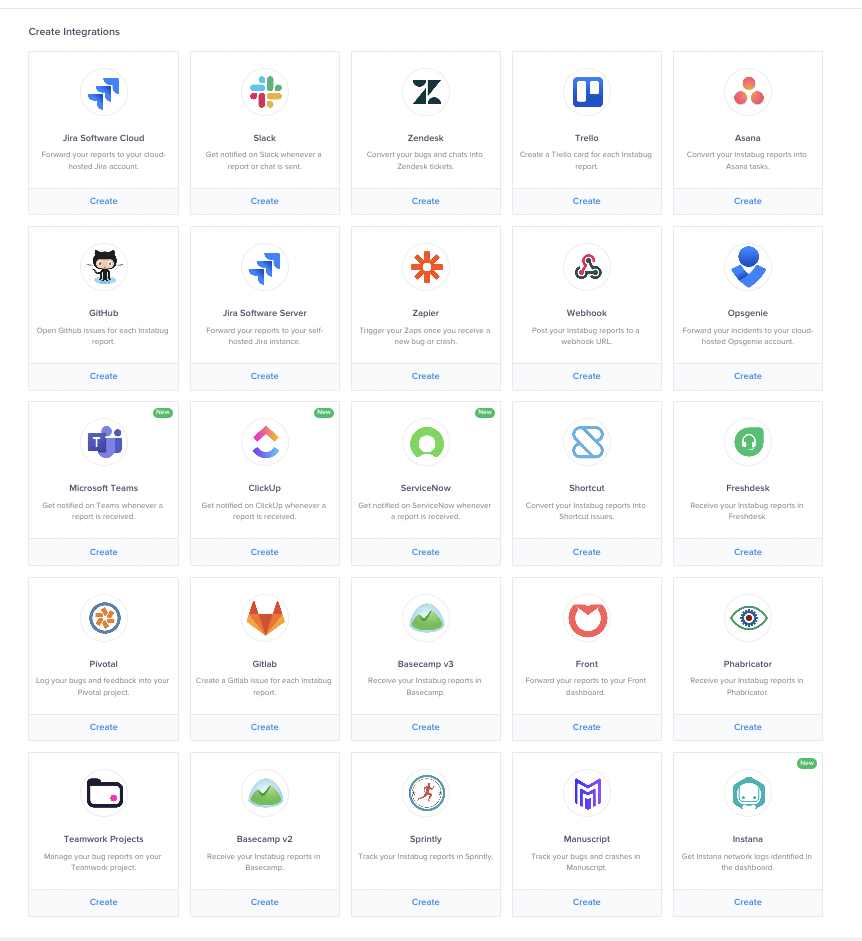
Integrations hub
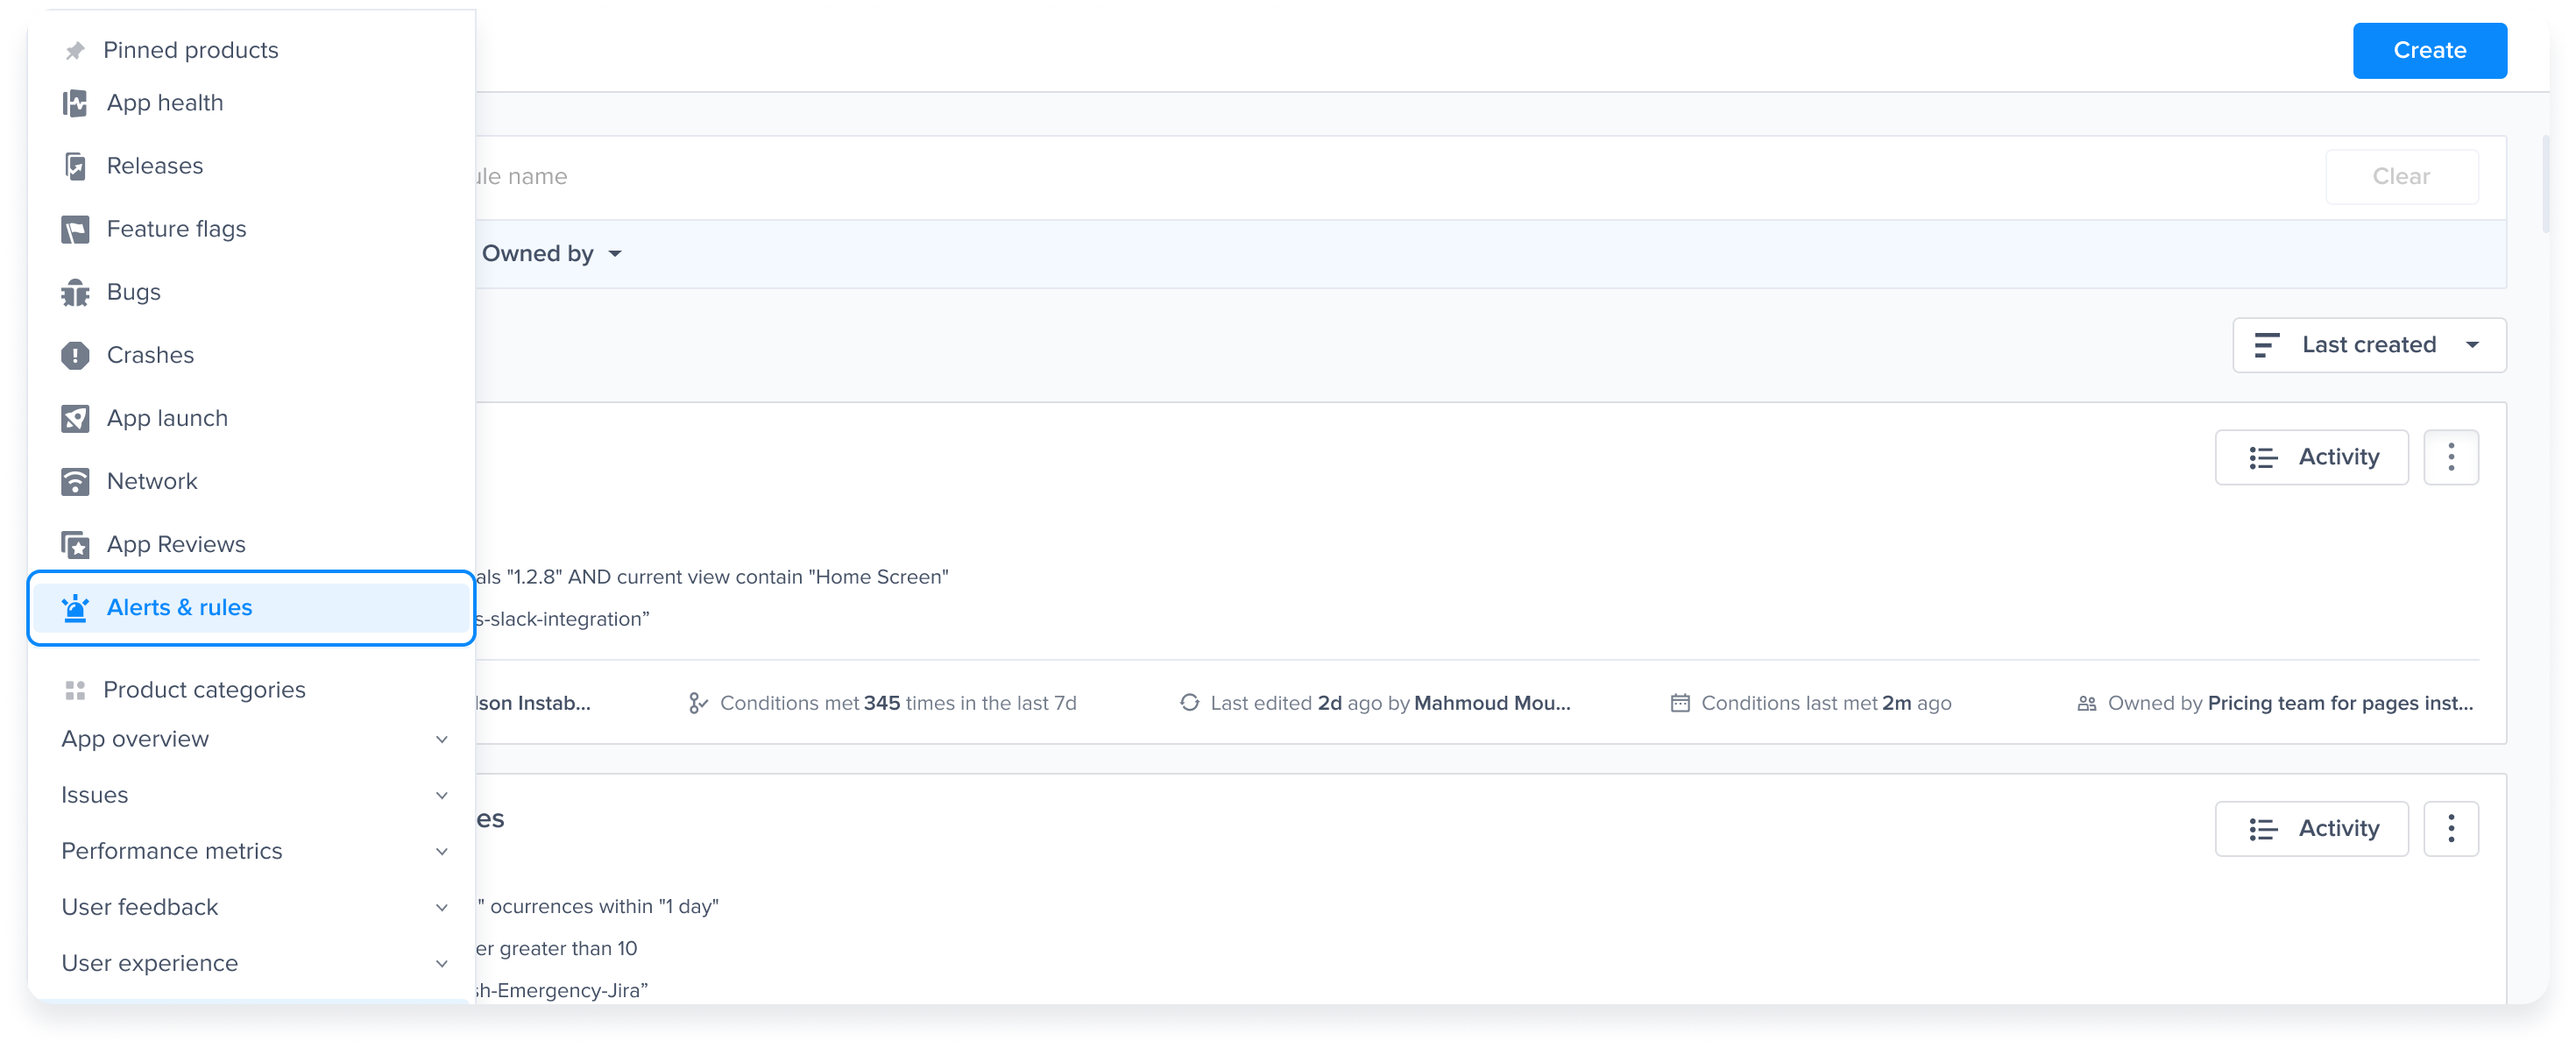
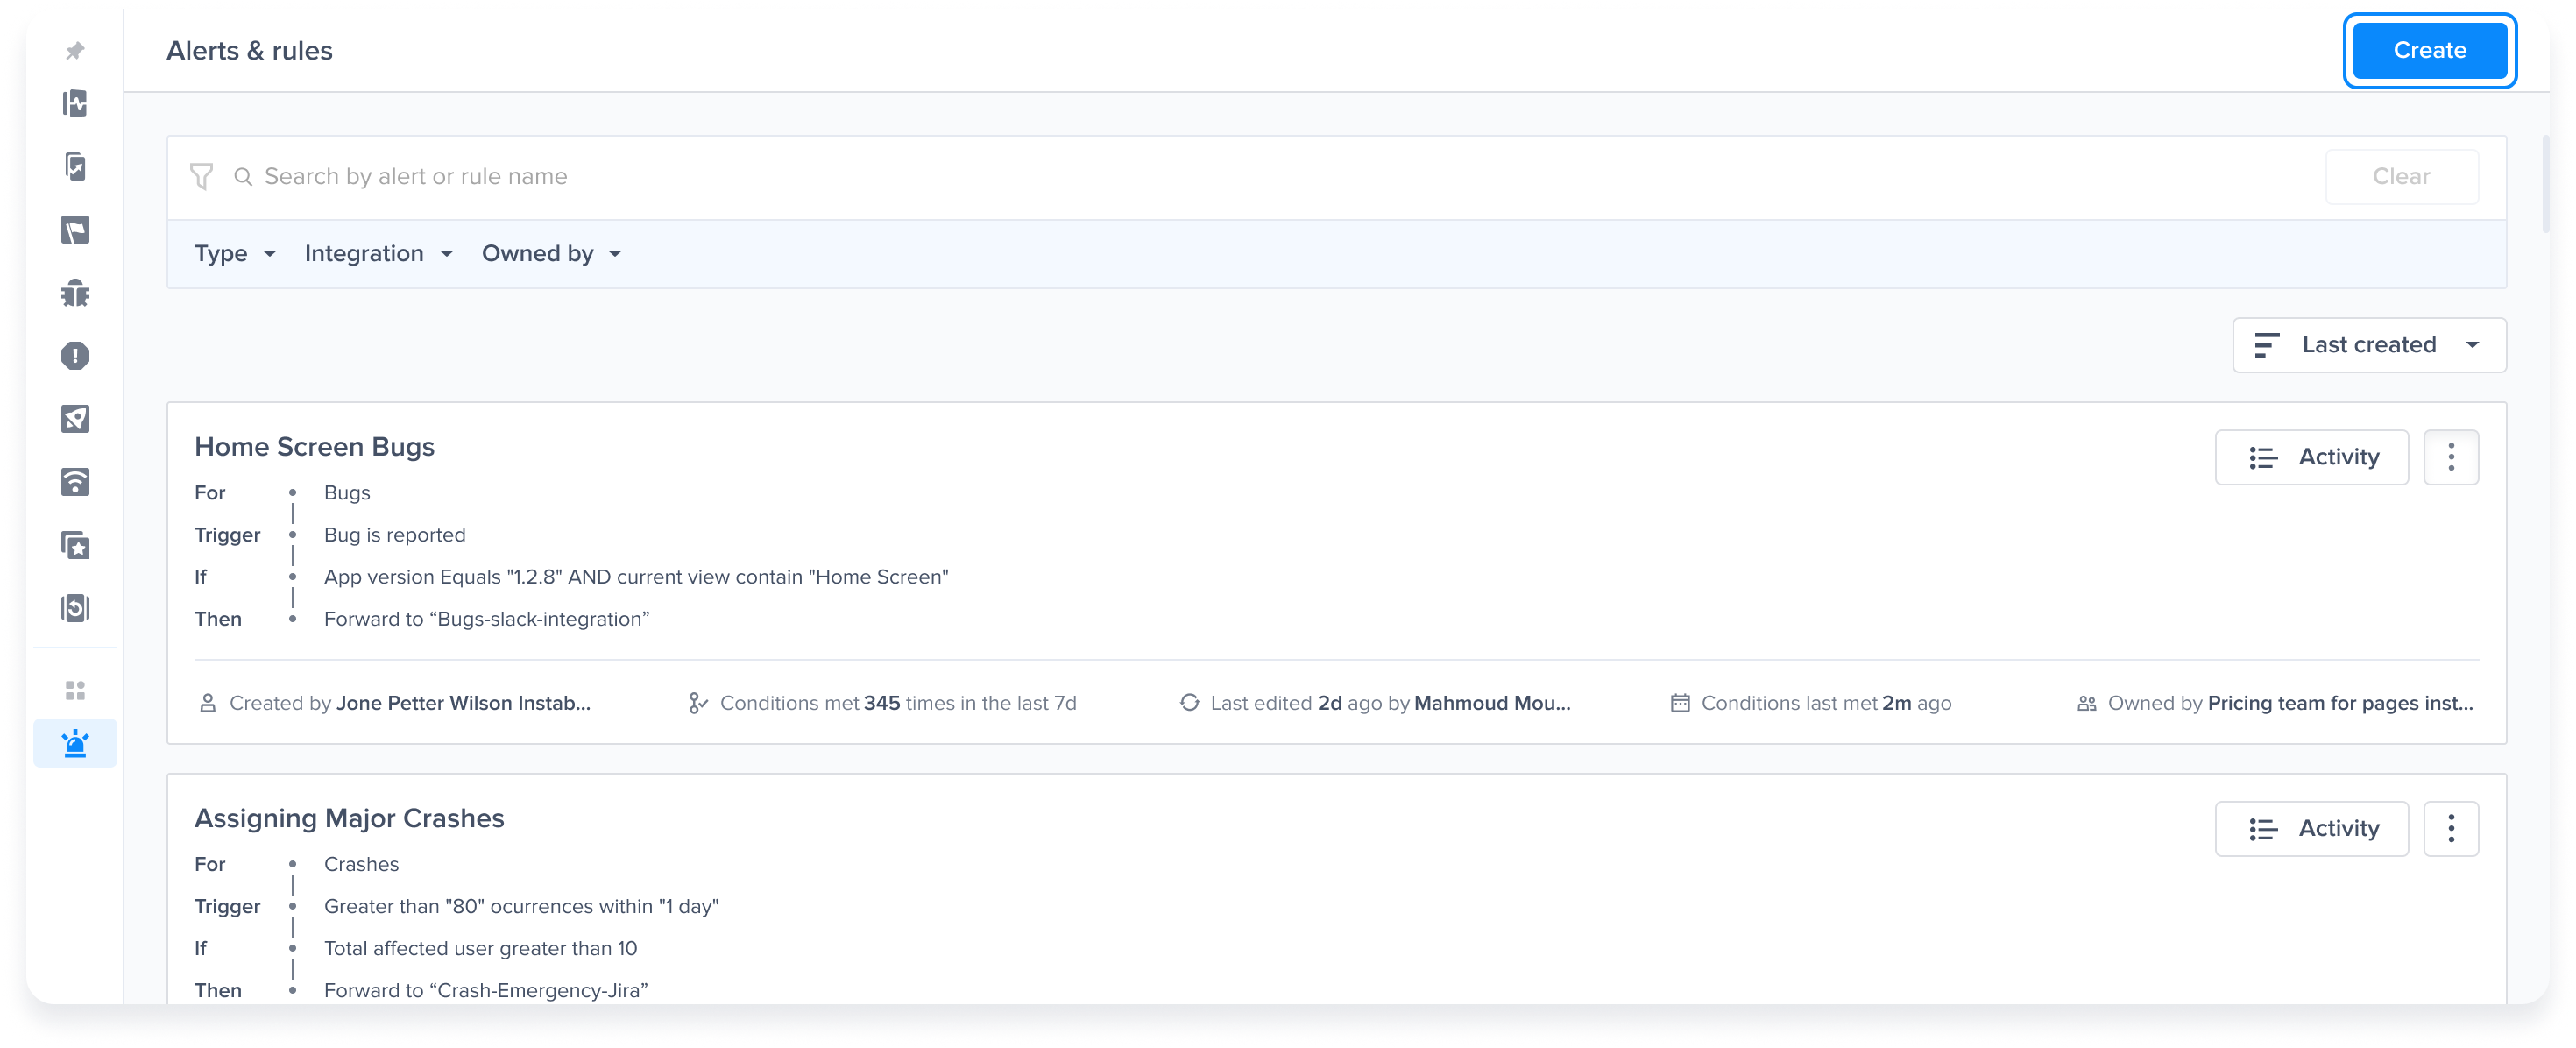
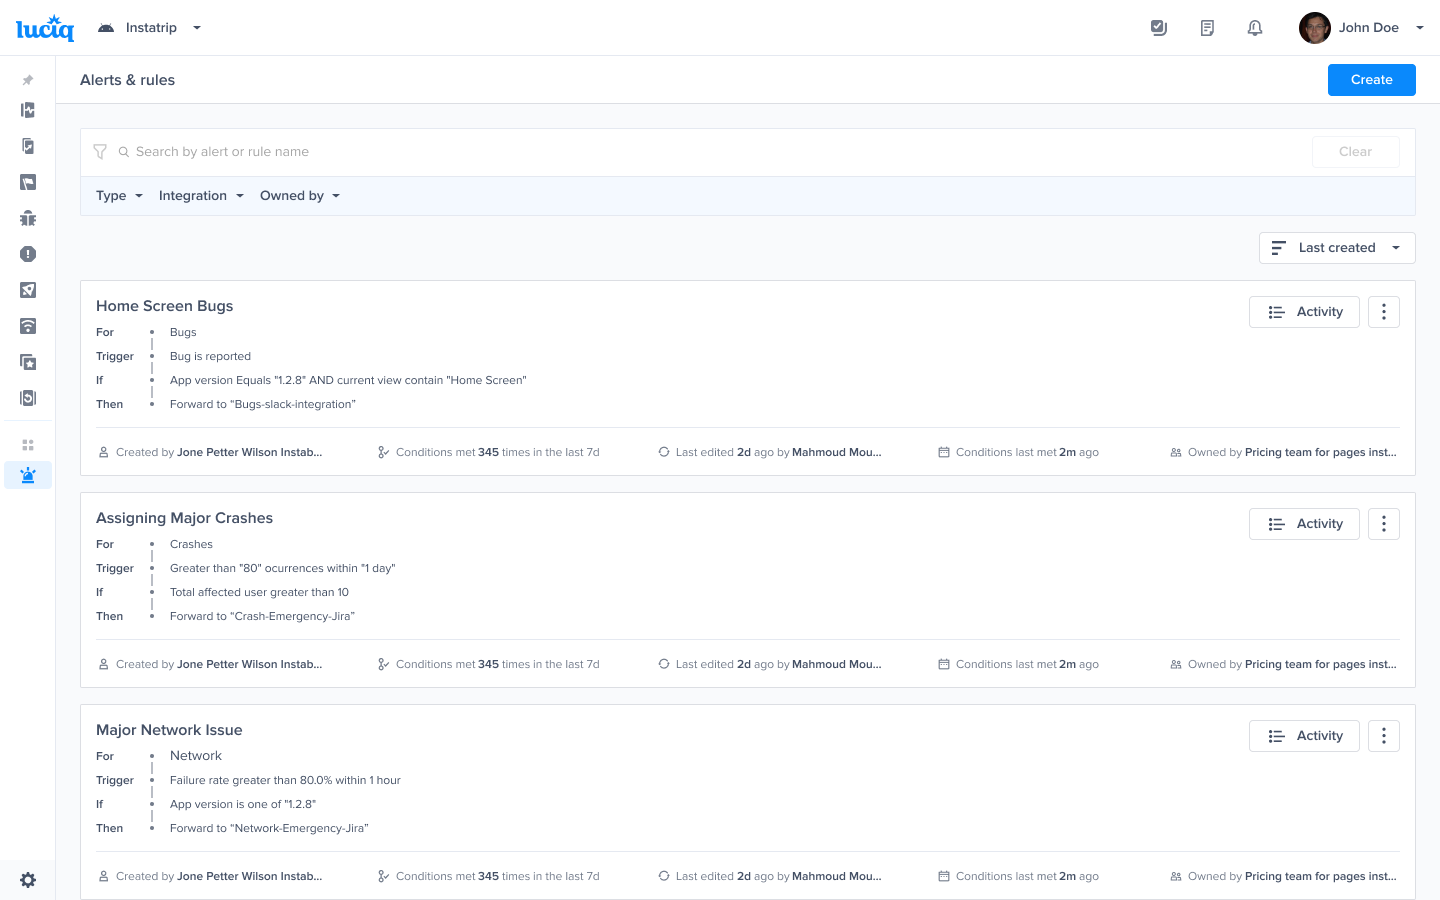
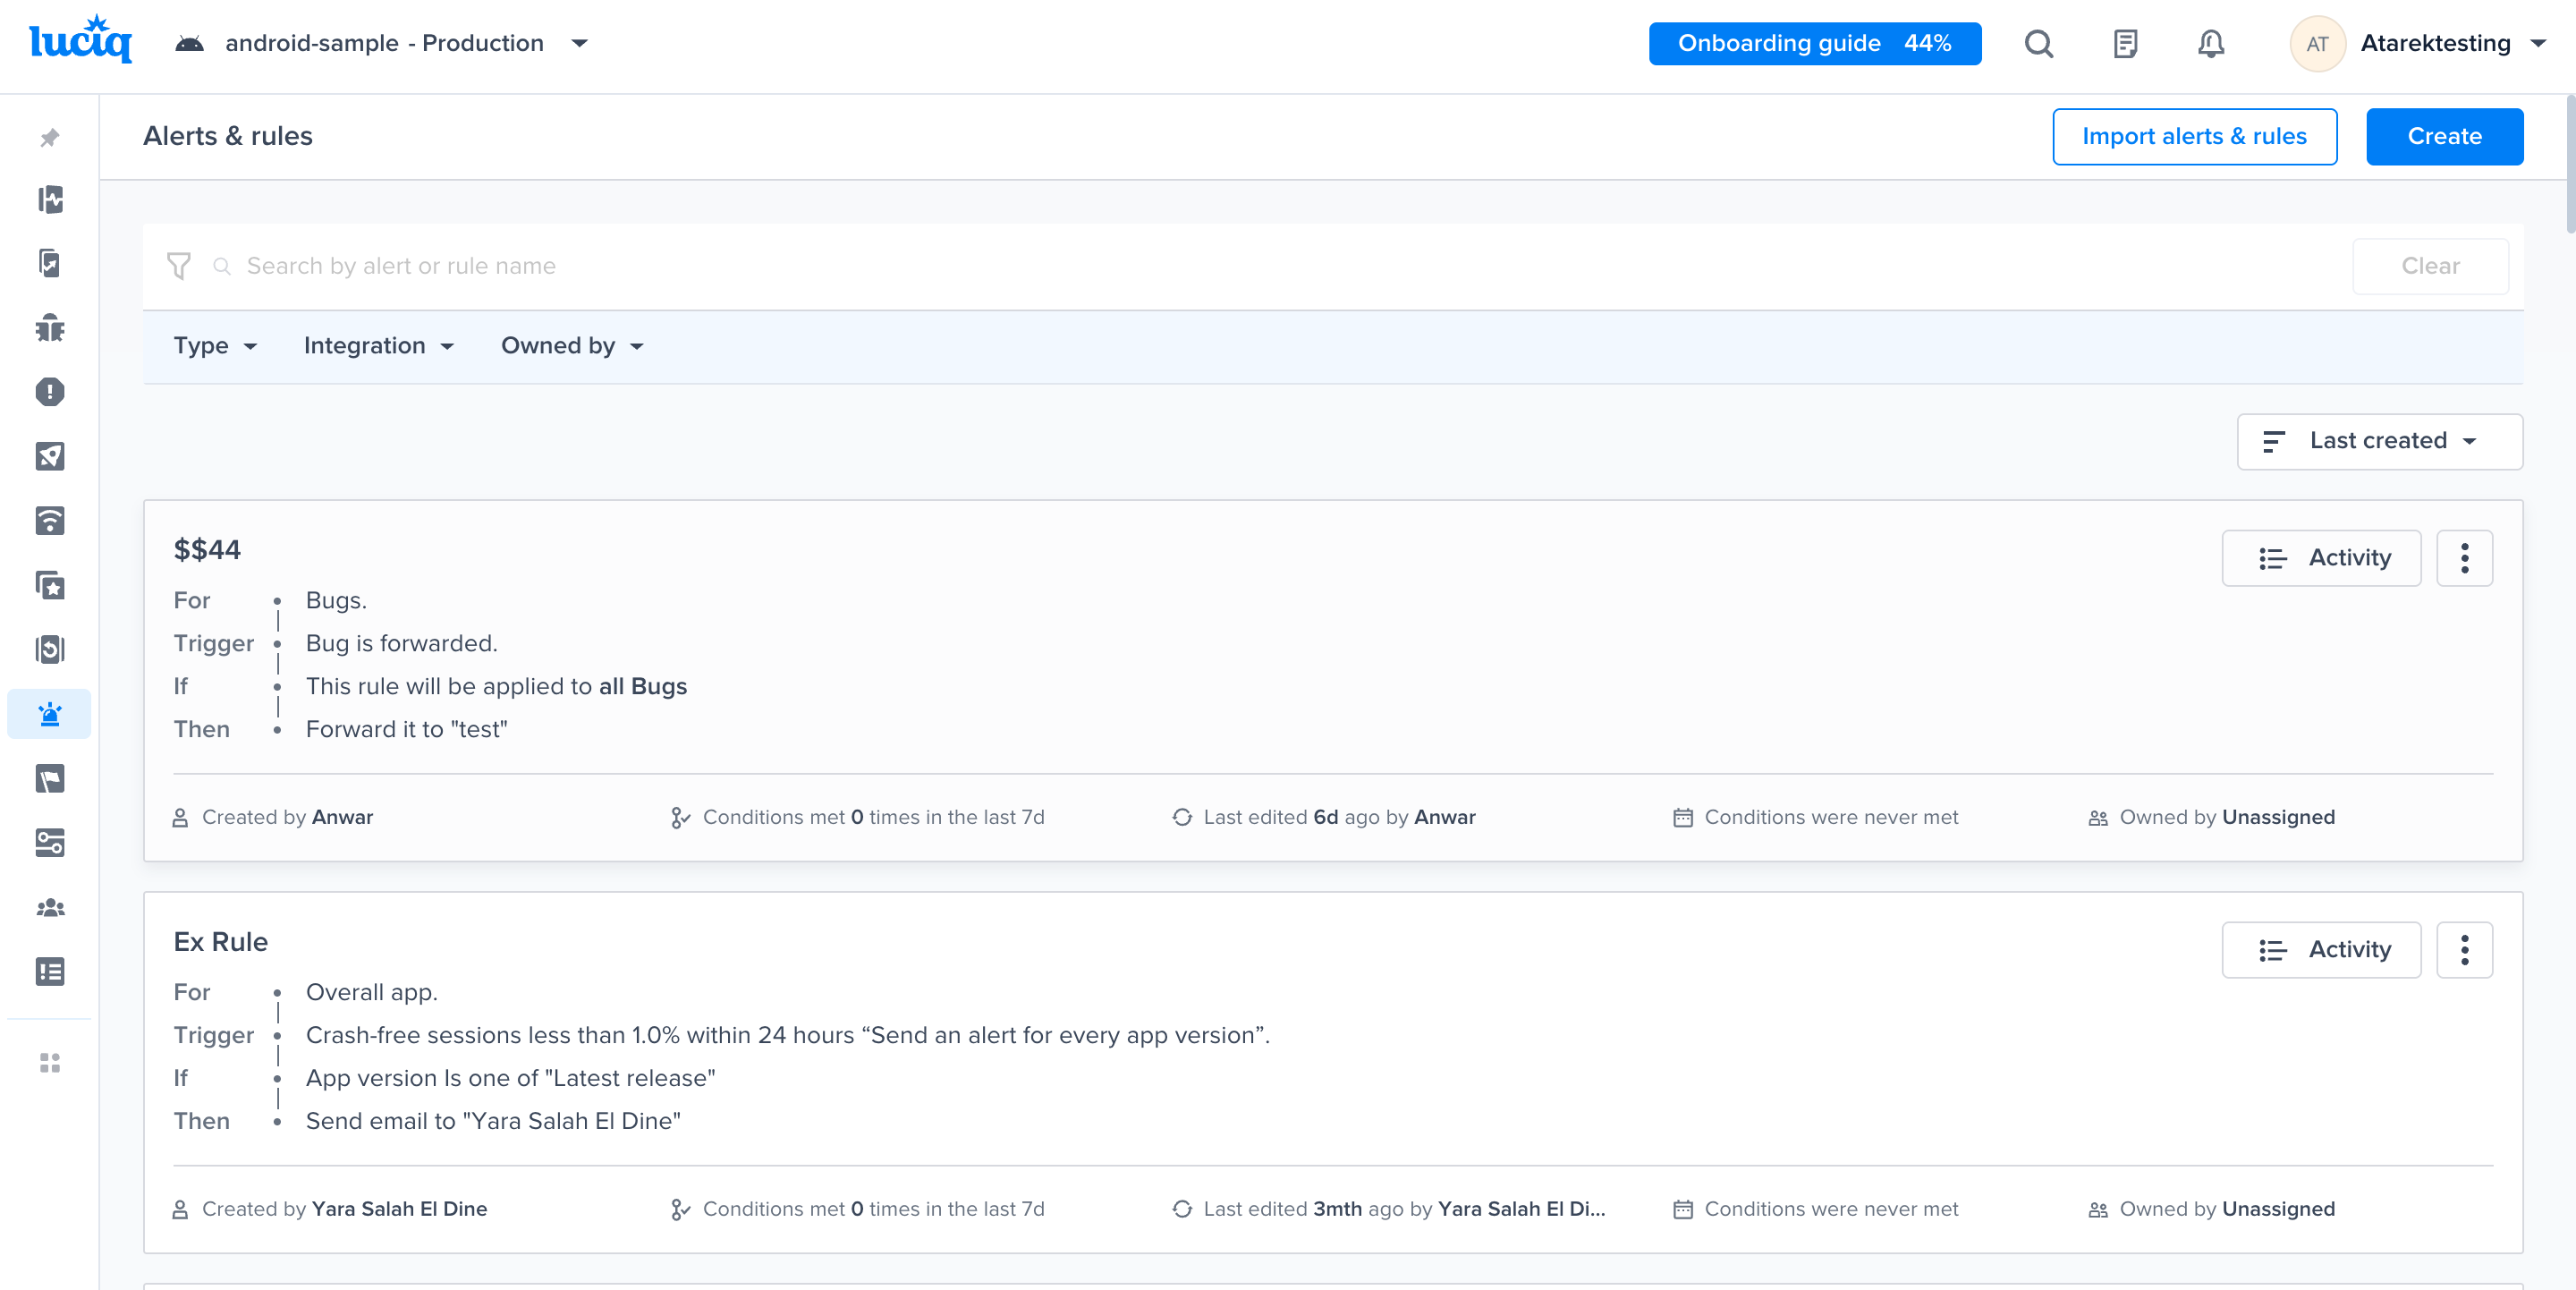
Alerts and Rules page from the Luciq menu
Use this filter to view previously created rules

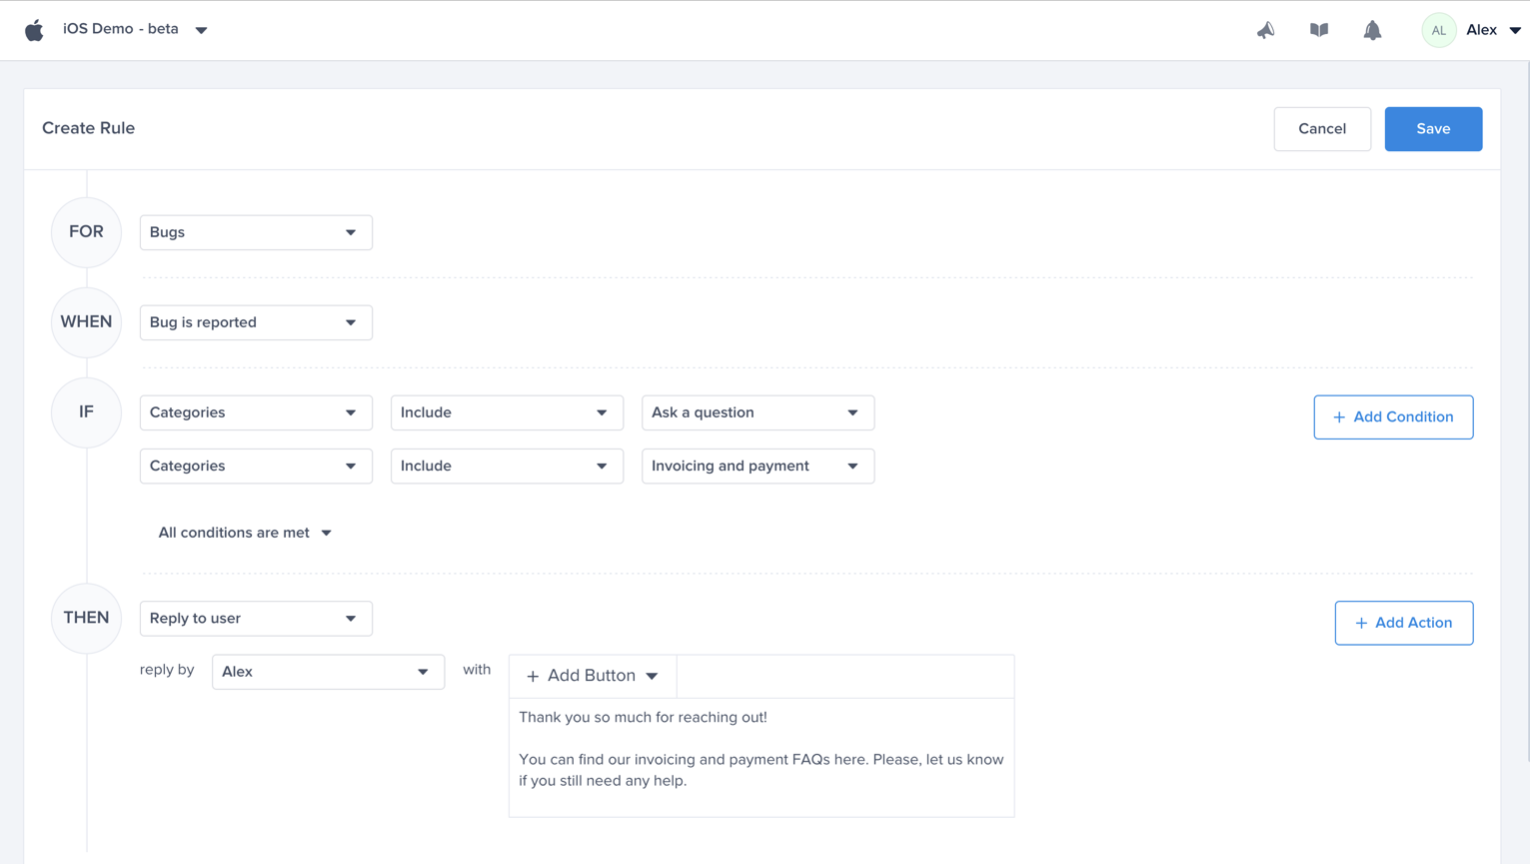
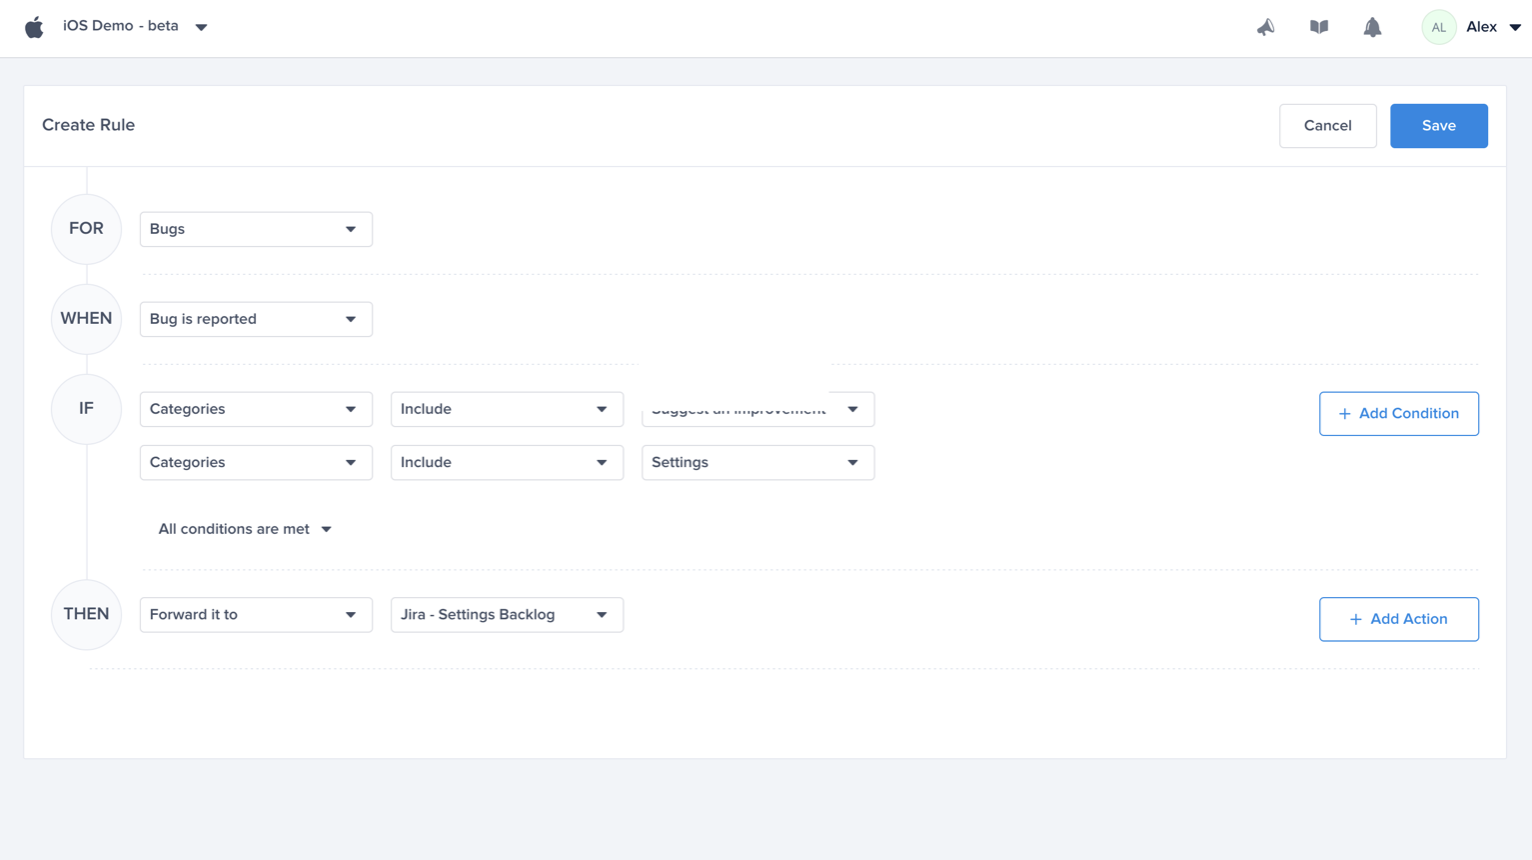
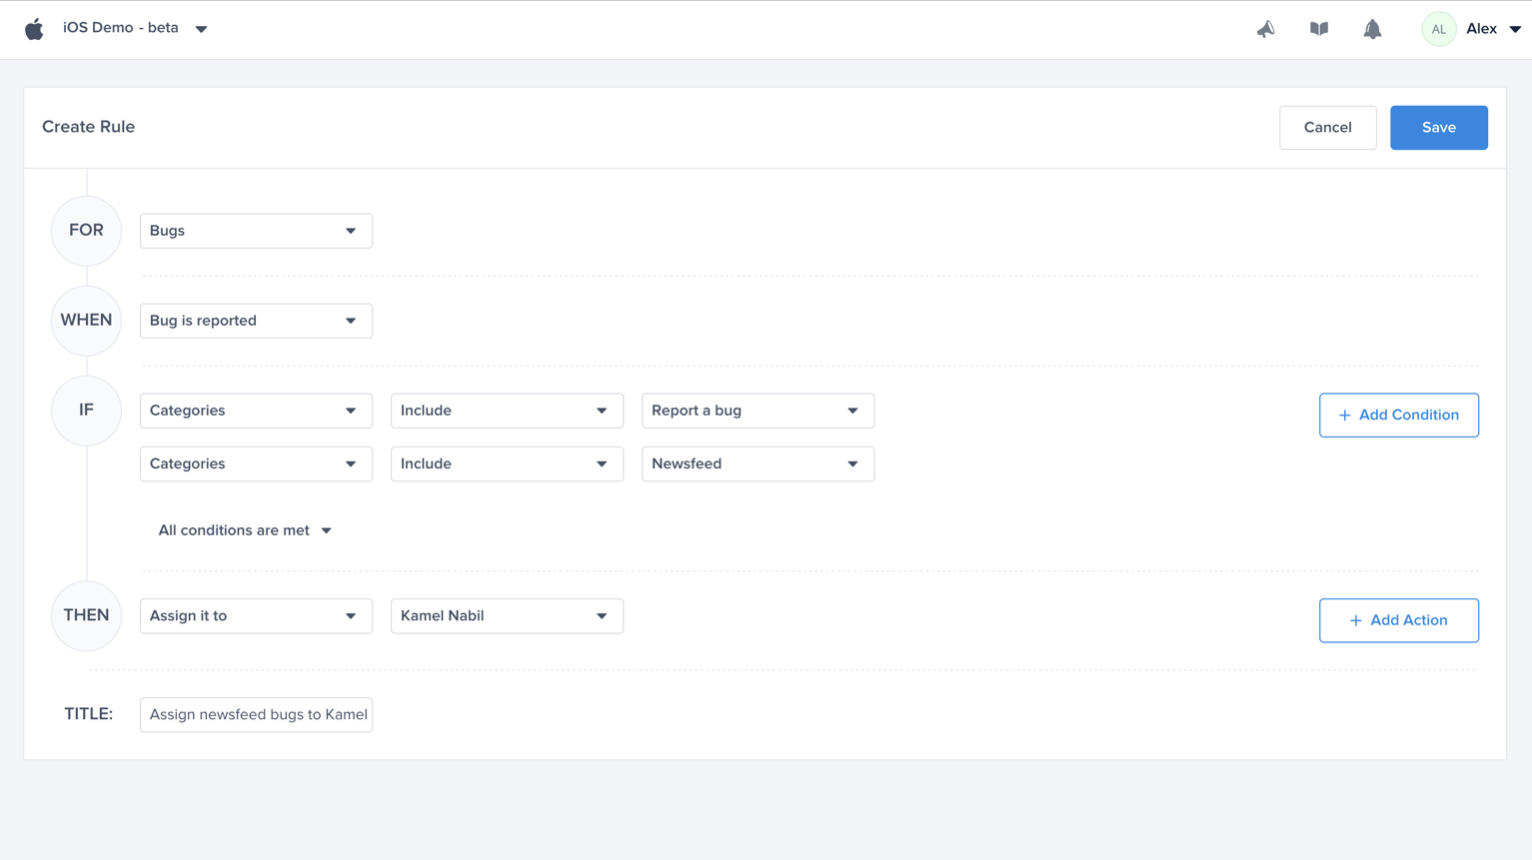
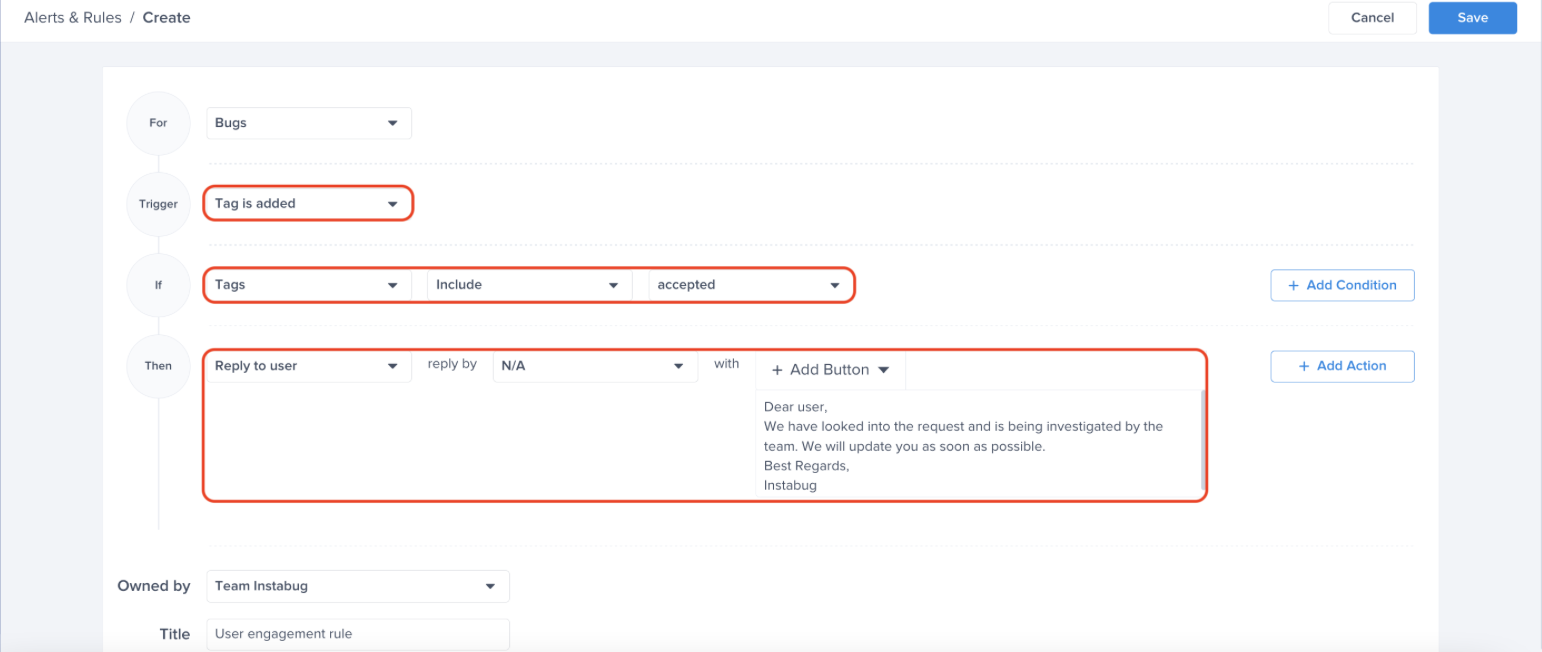
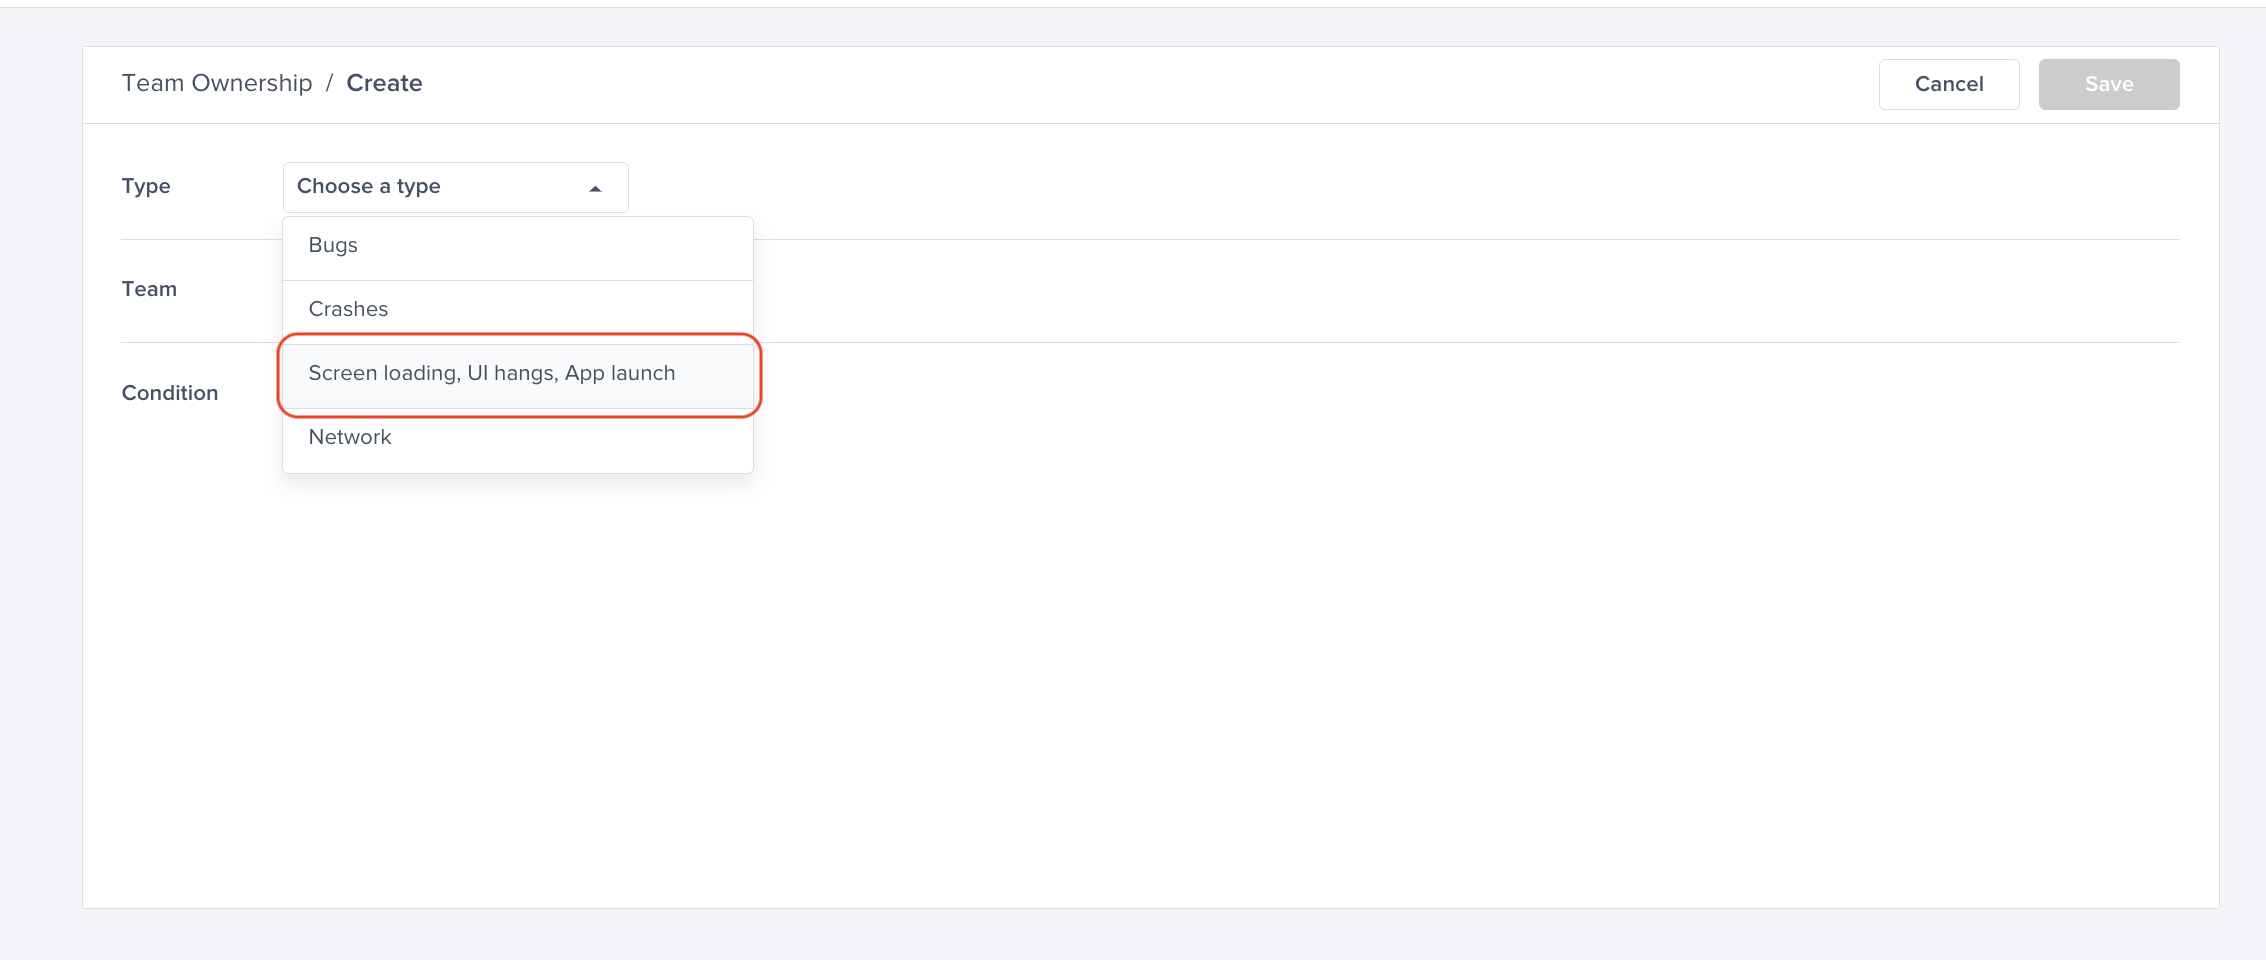
Choose a type - "For" - "Bugs"
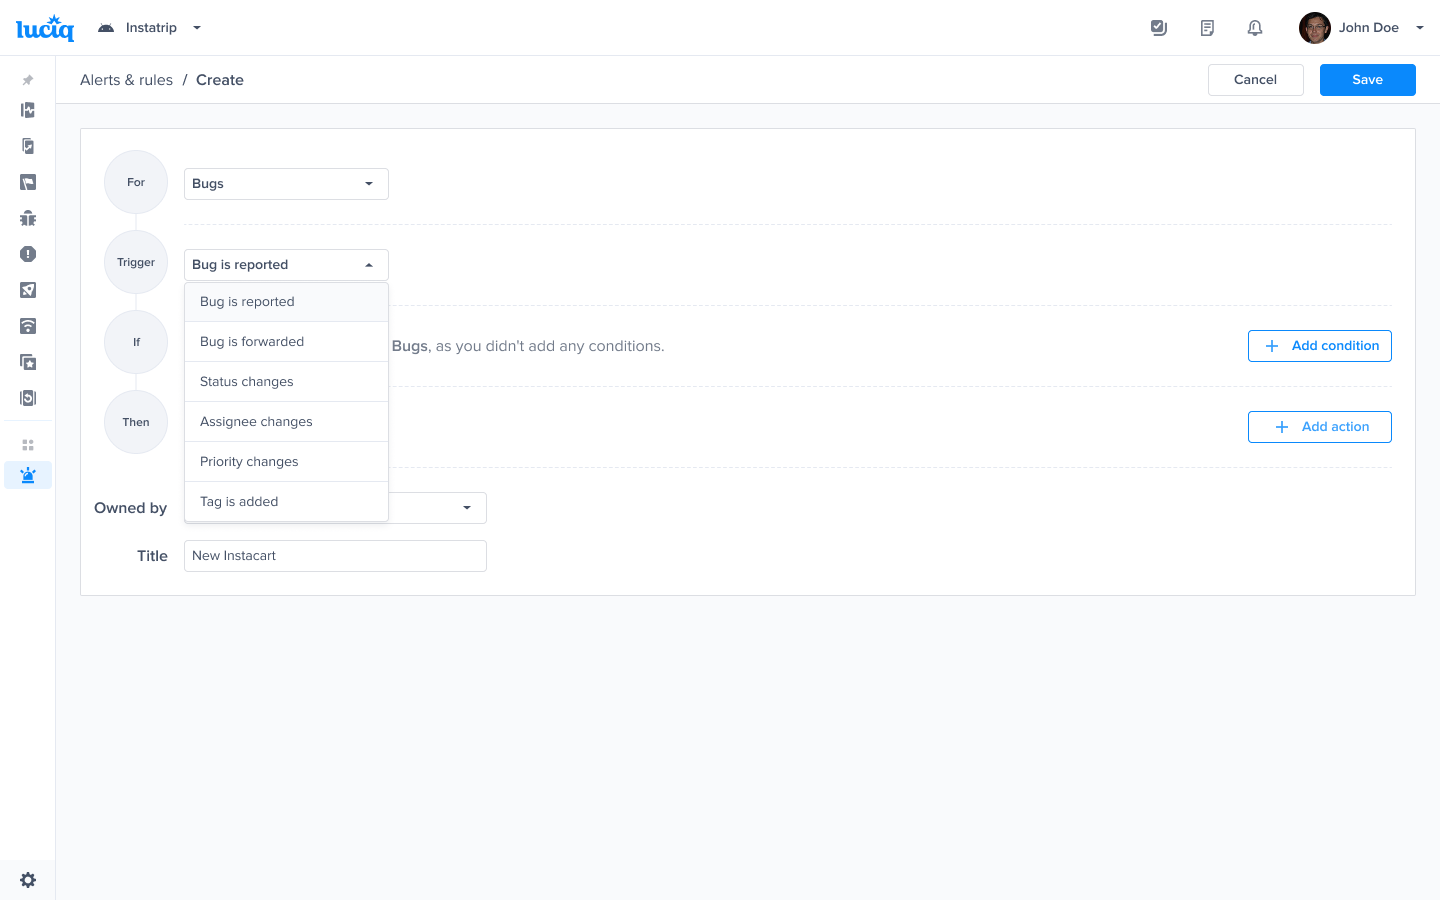
Choose a trigger

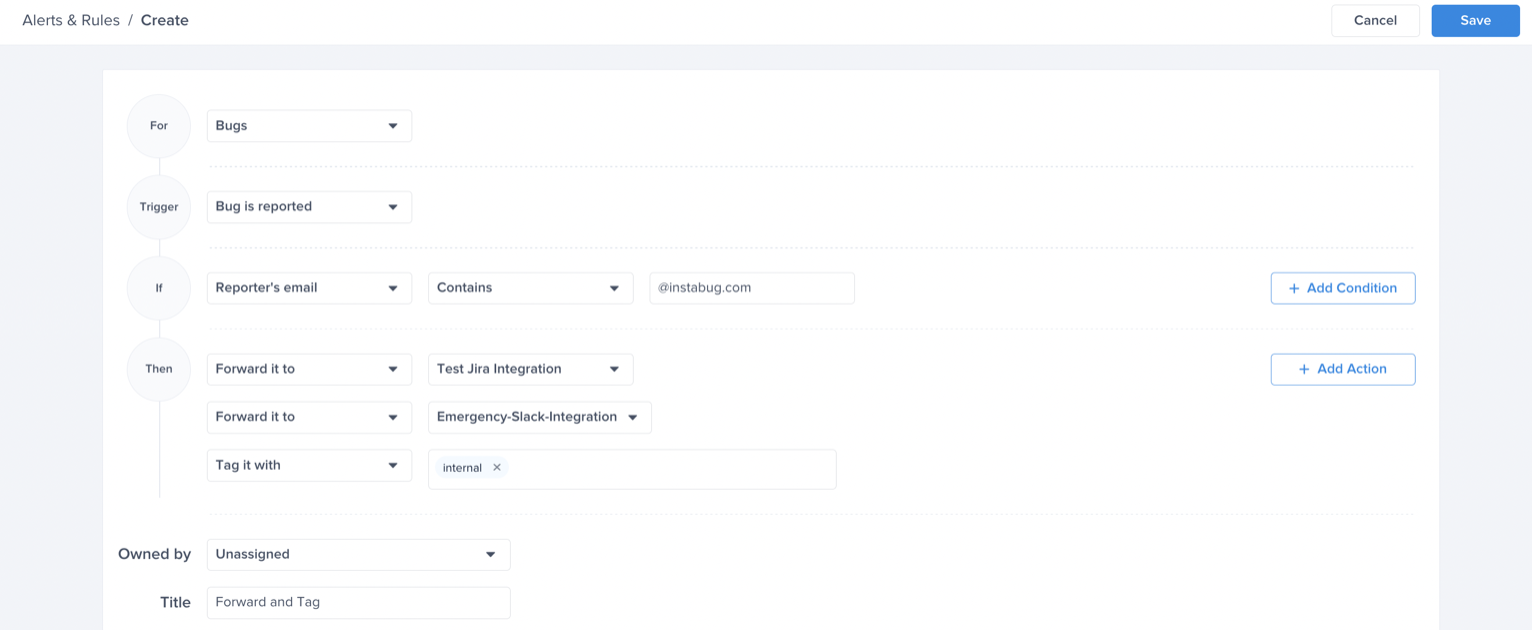
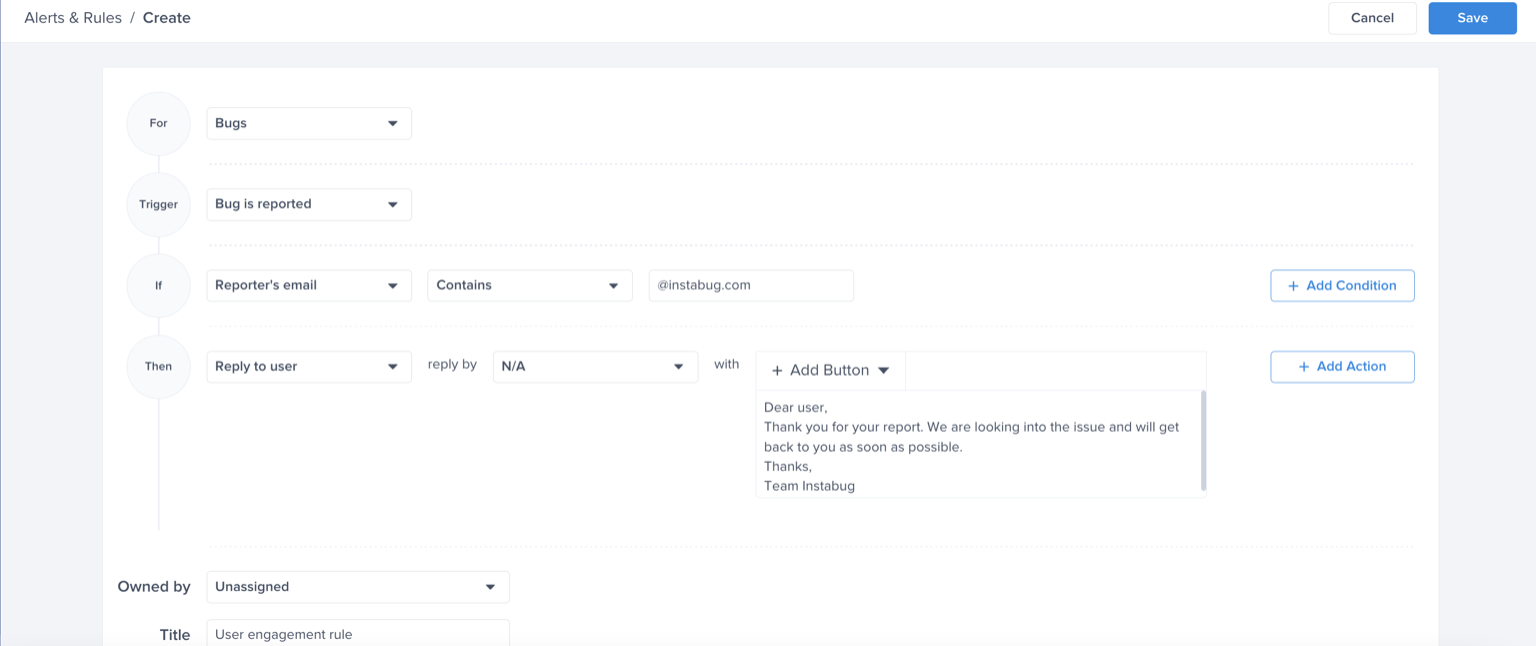
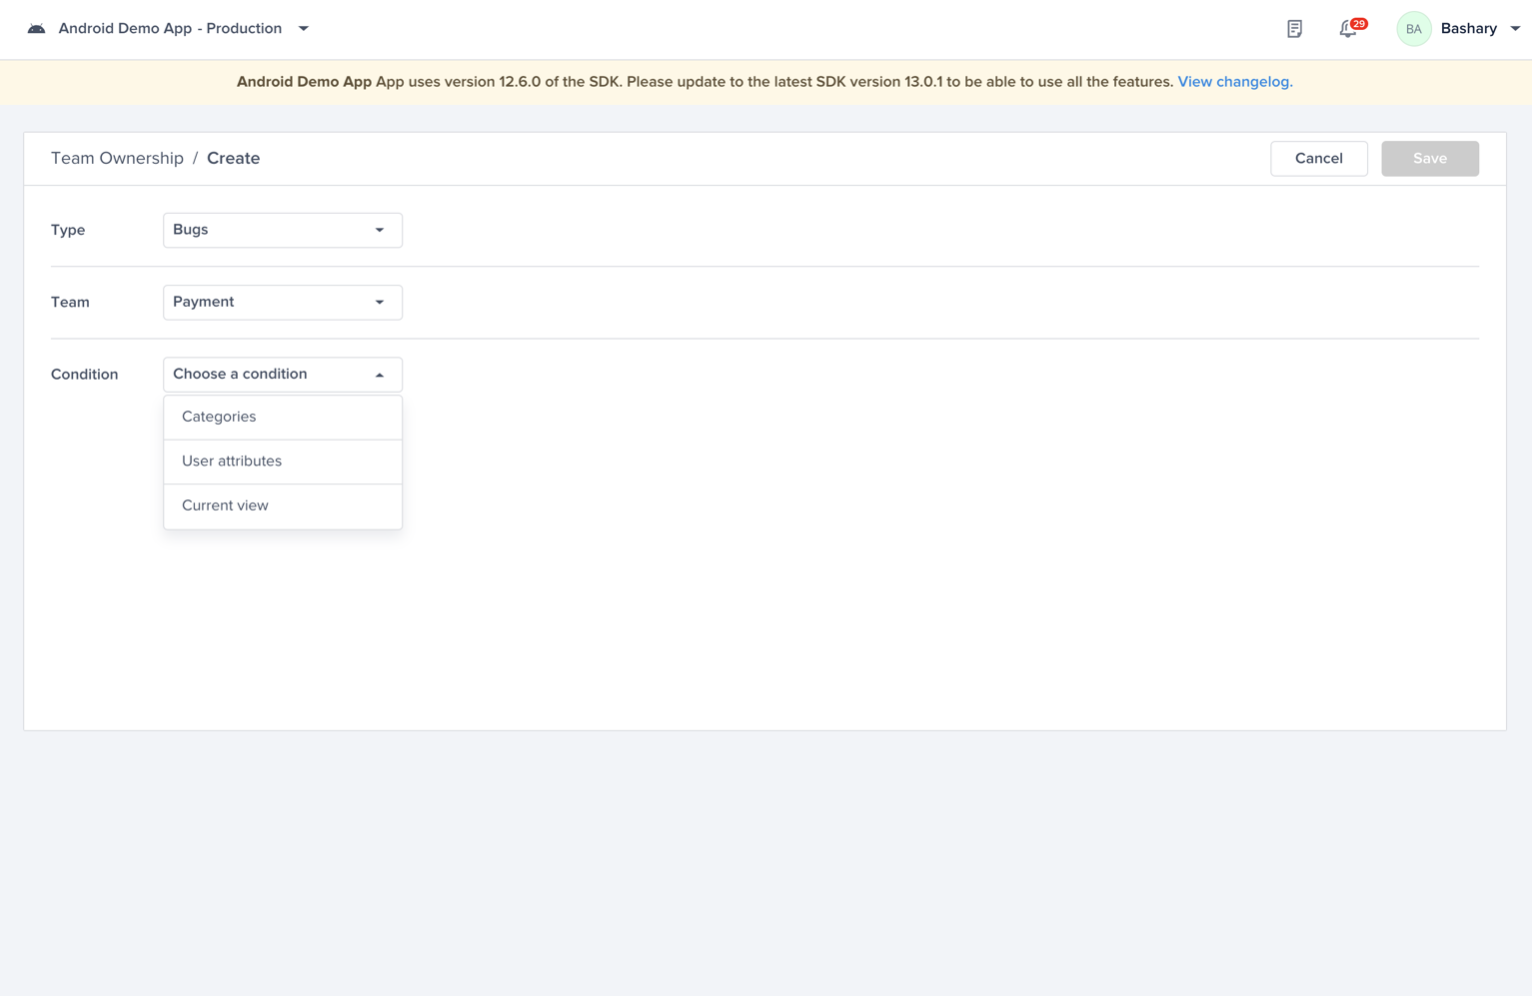
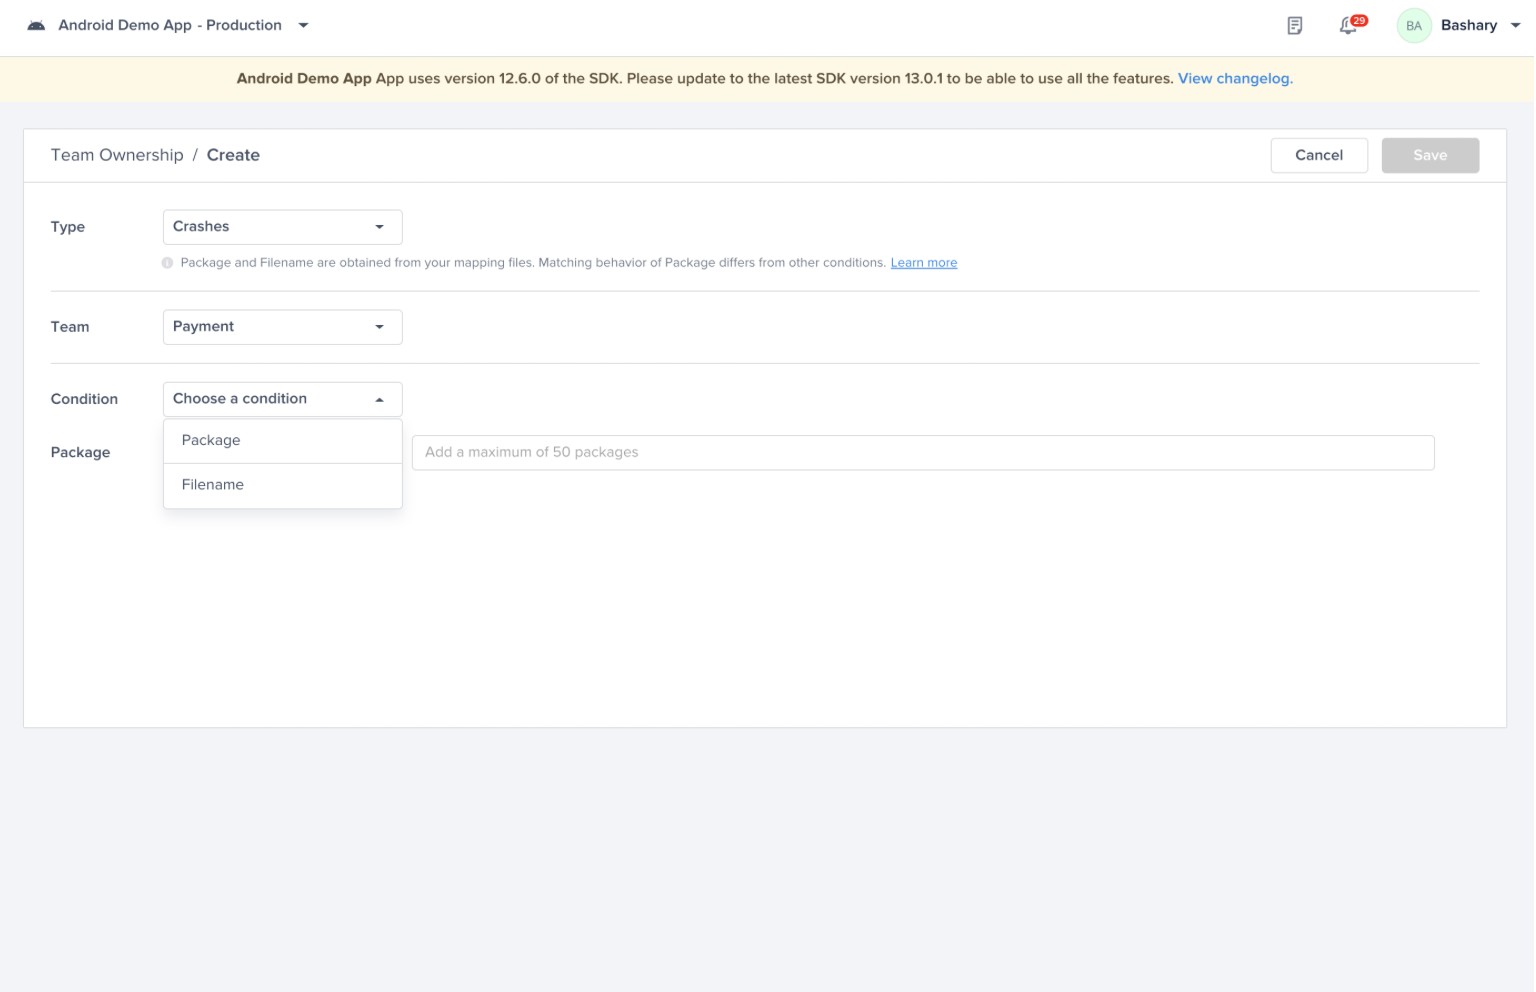
Choose one of the conditions
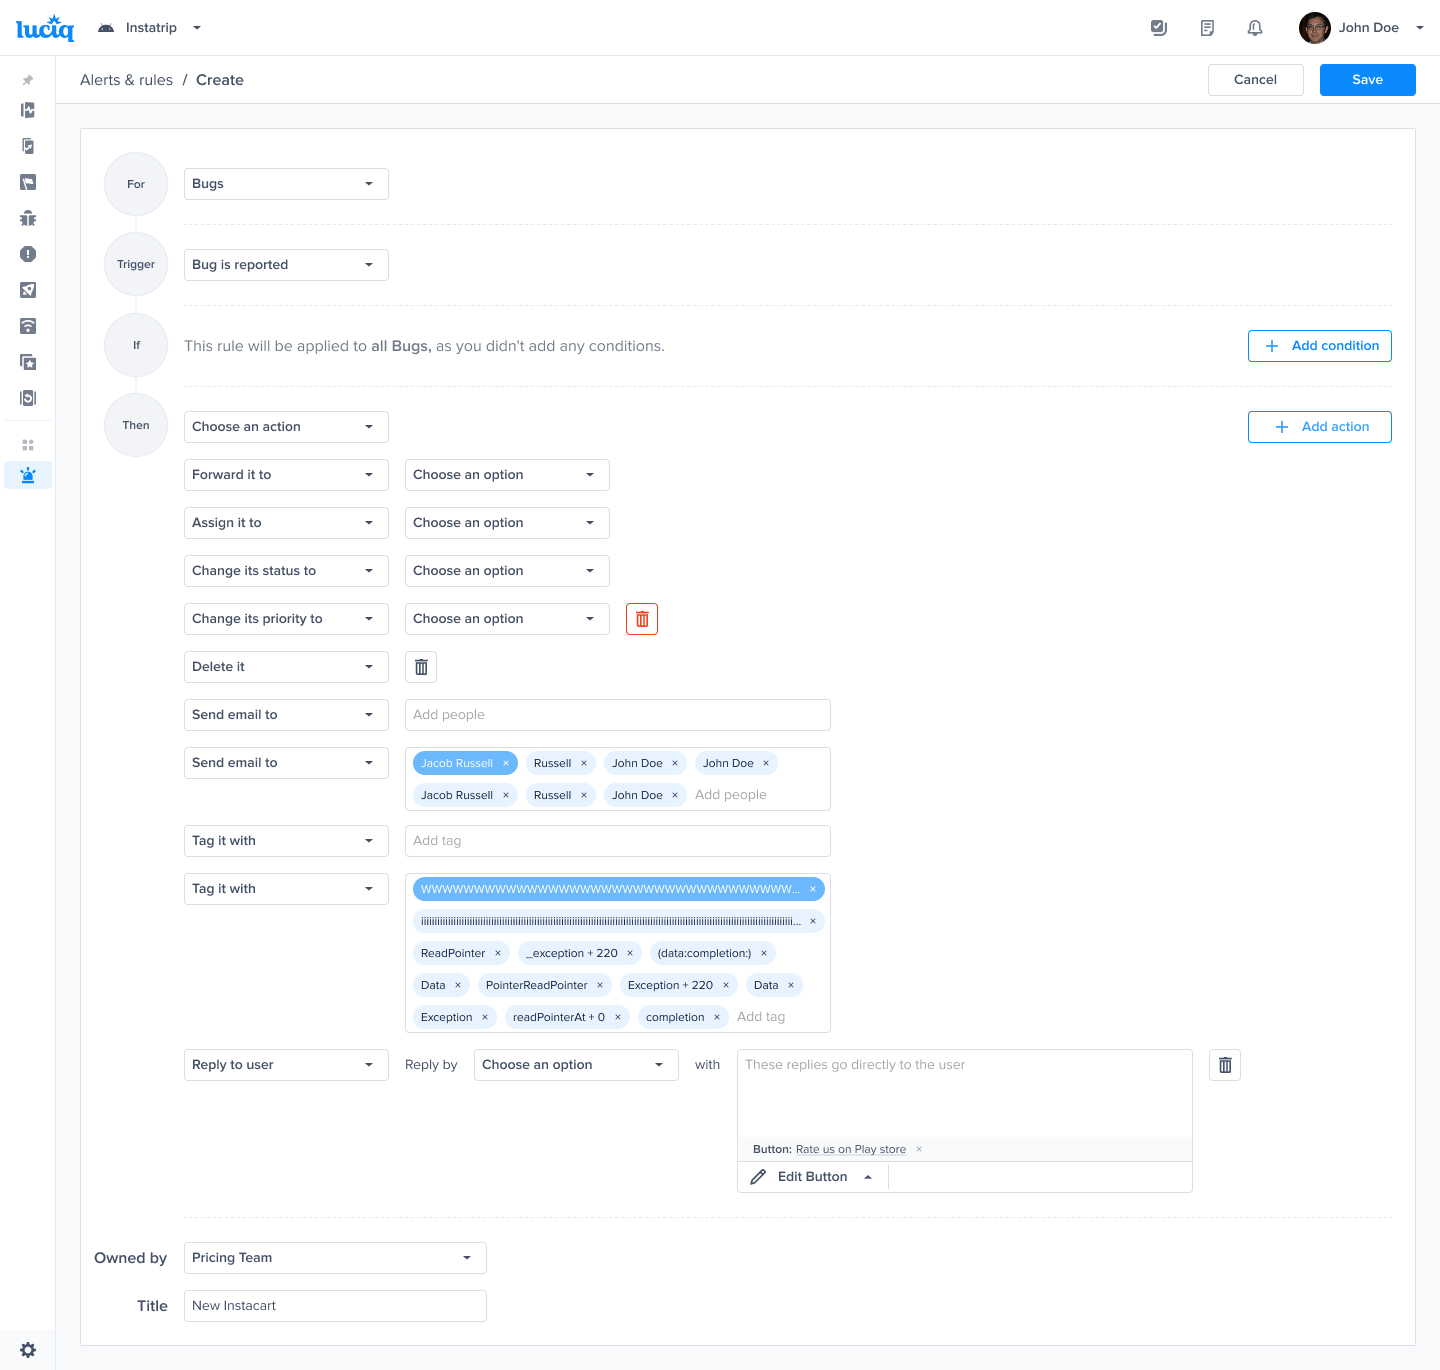
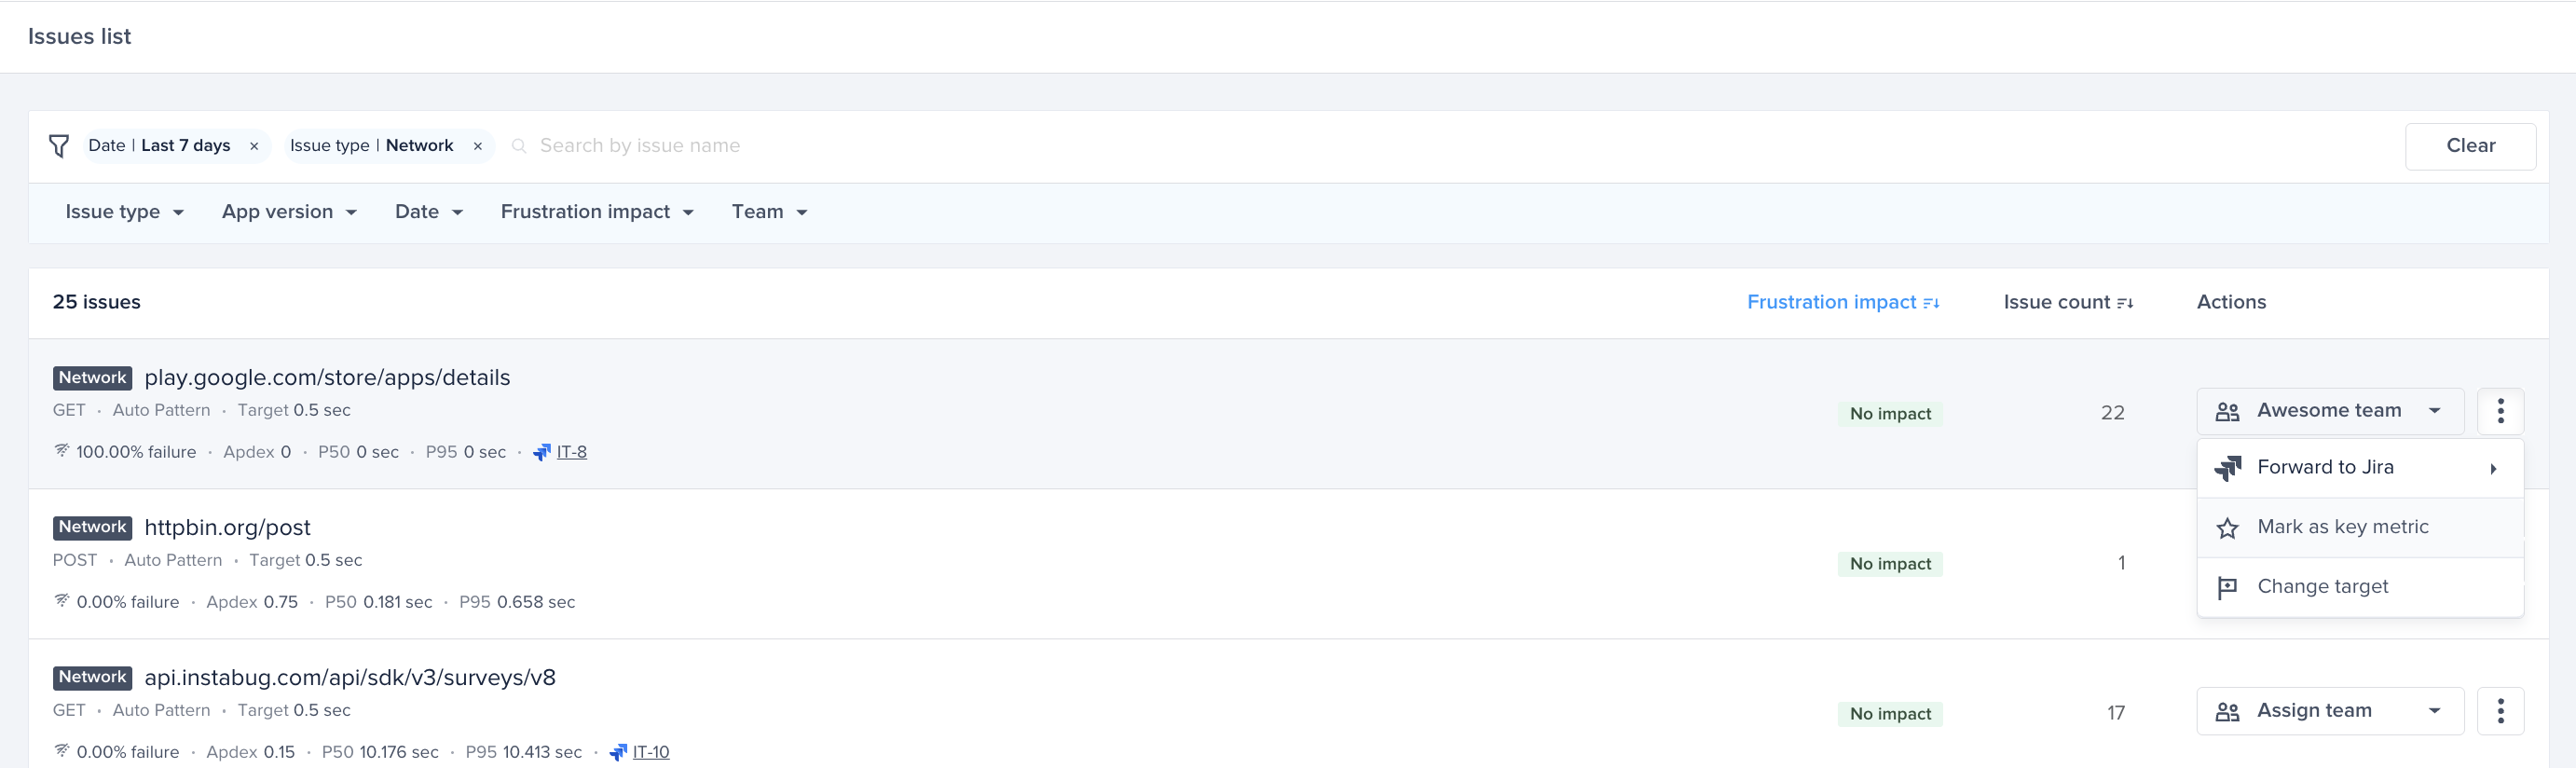
Choose one of the actions, for example: forward to the relevant Jira project

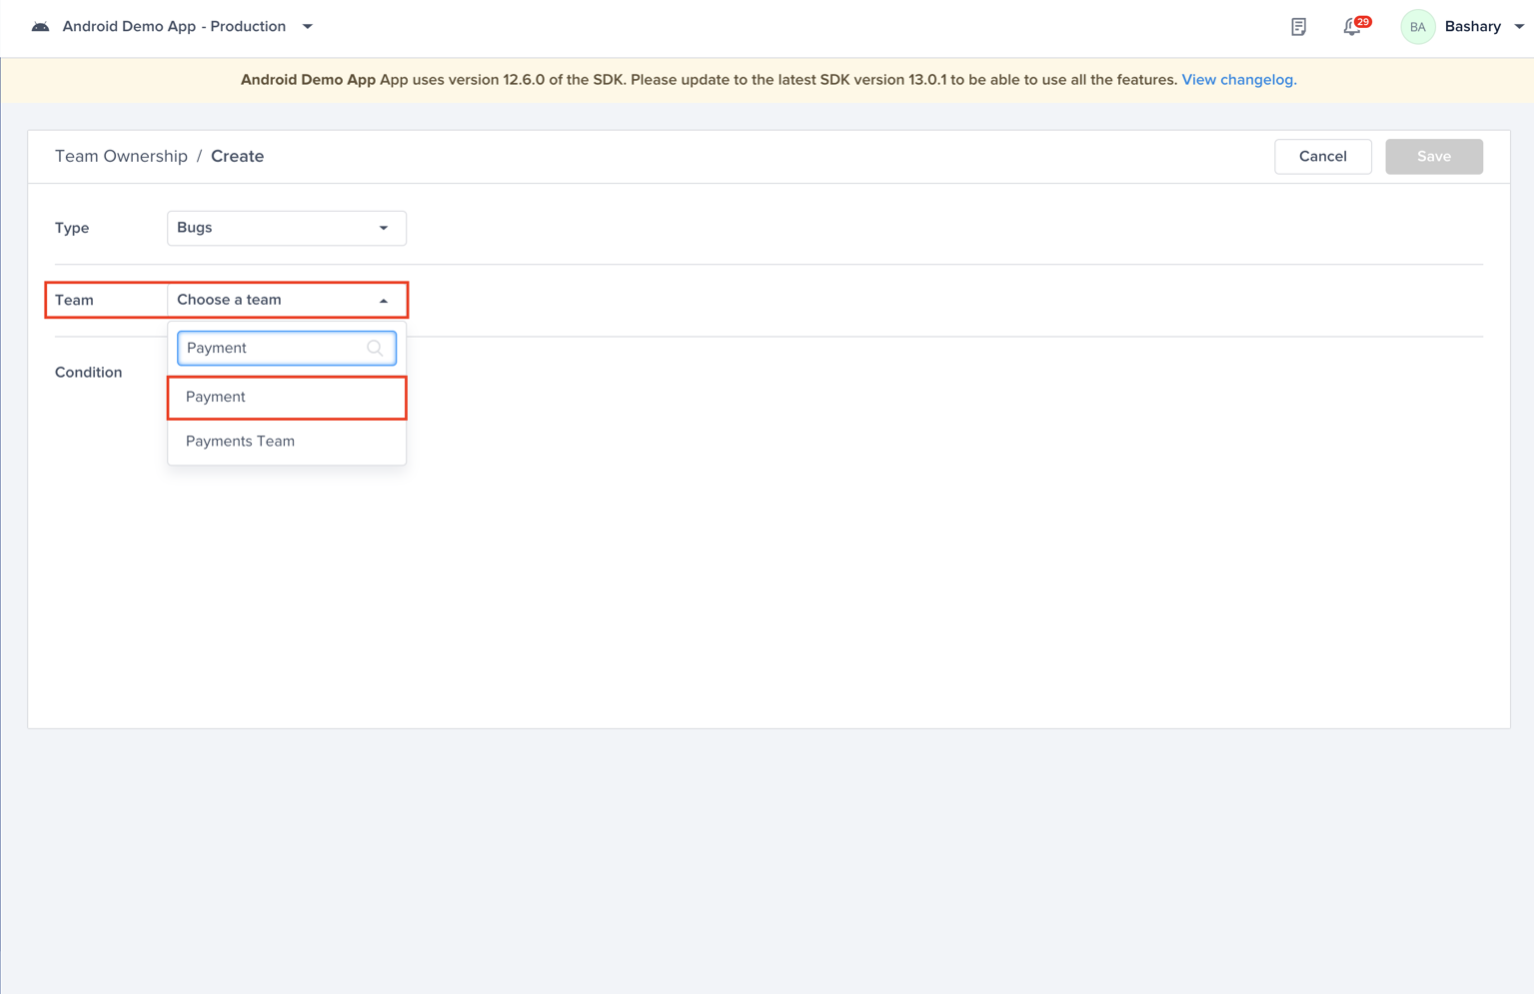
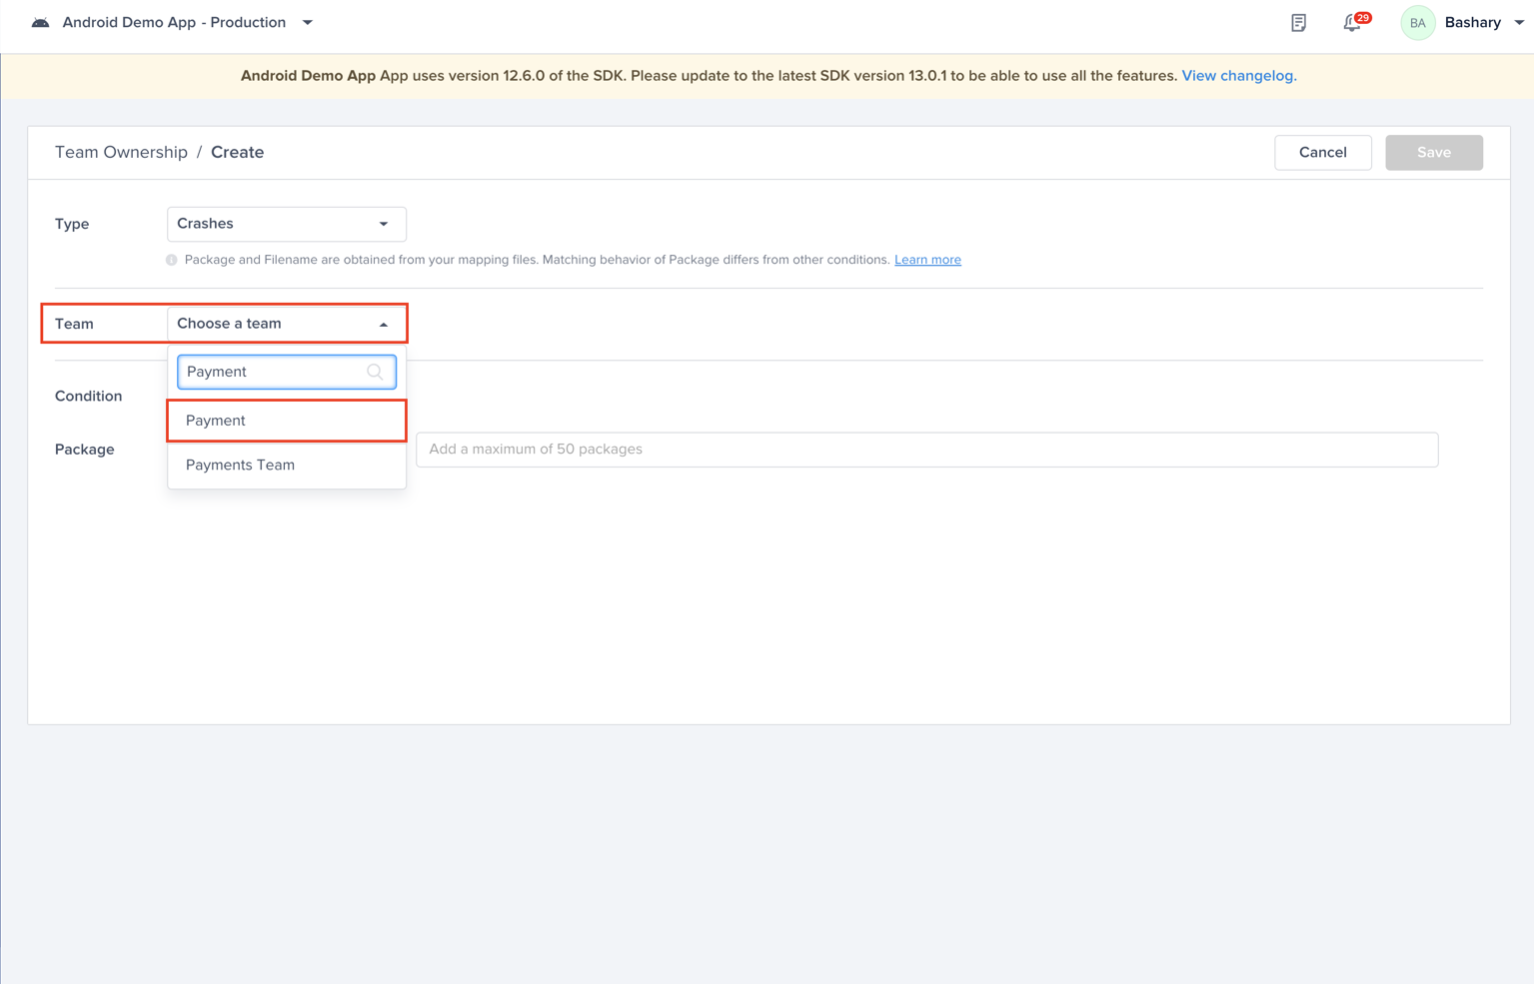
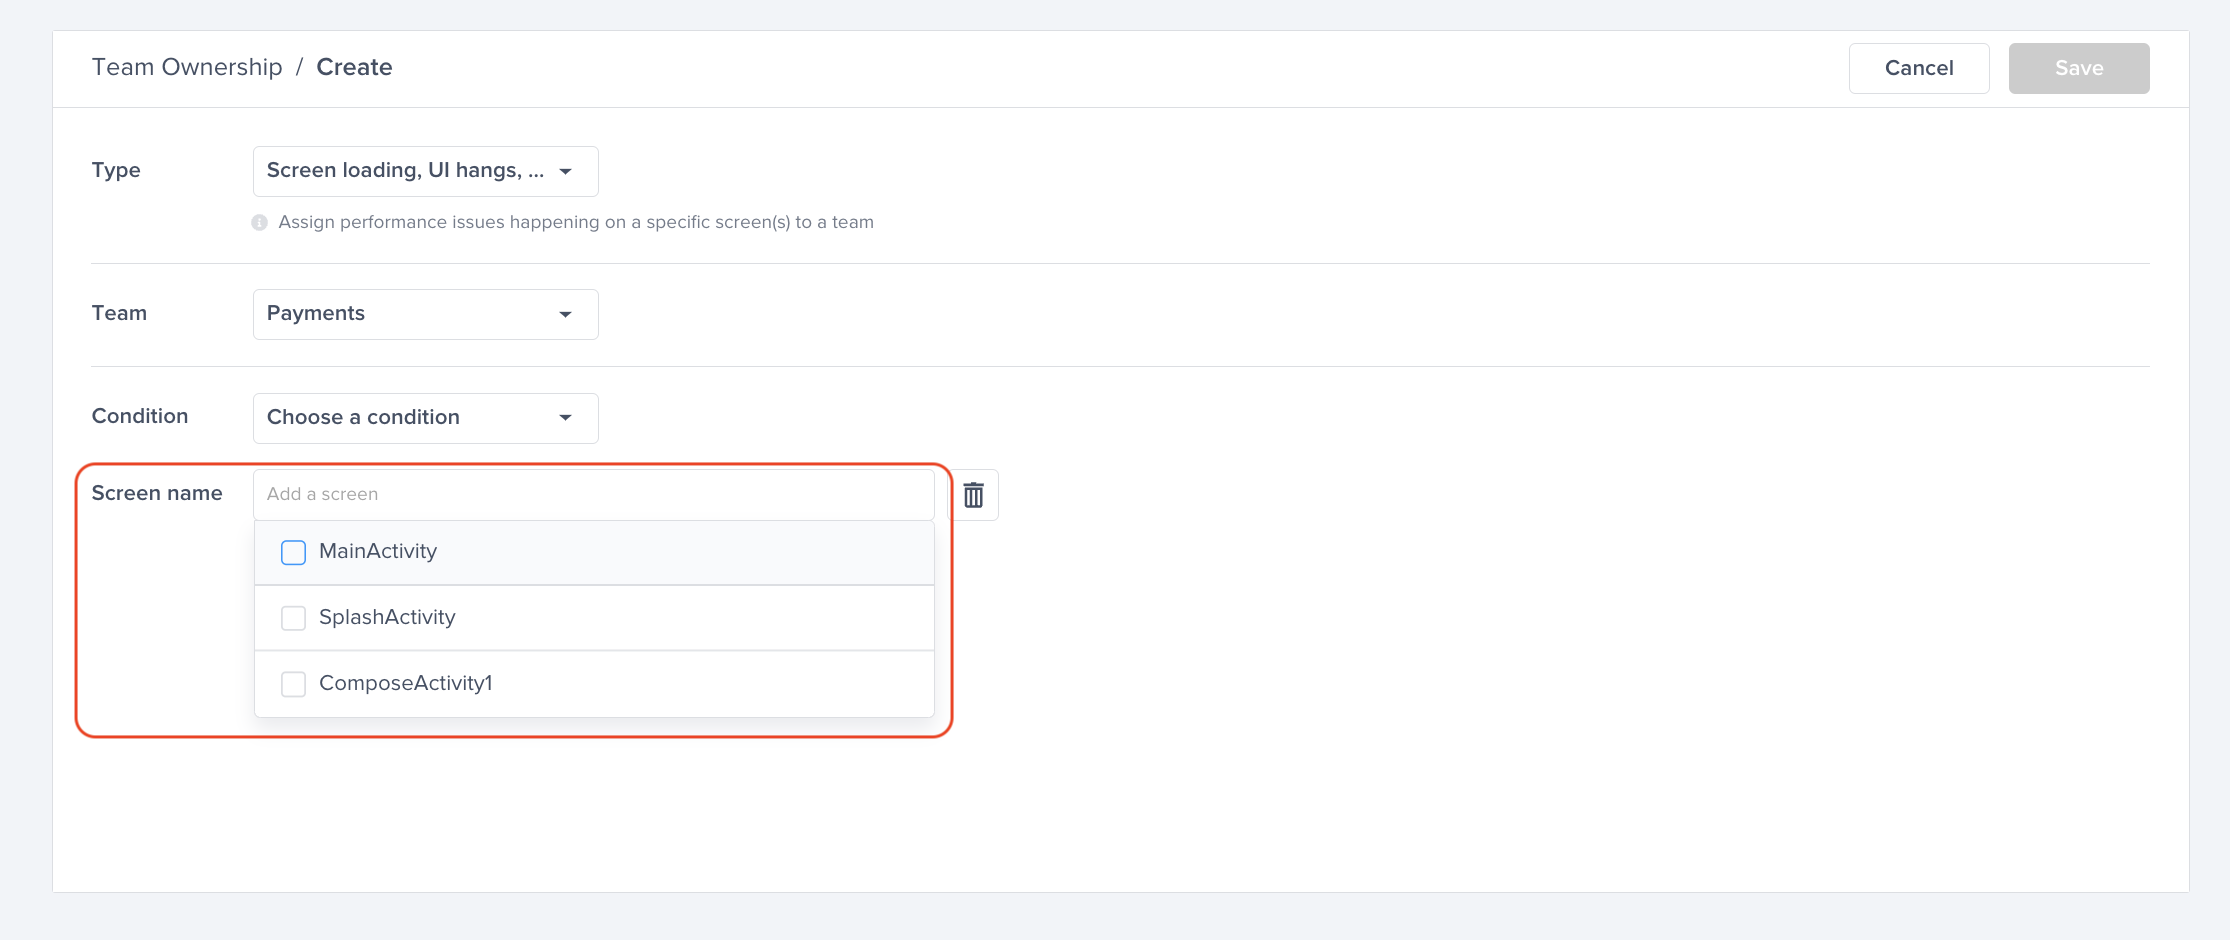
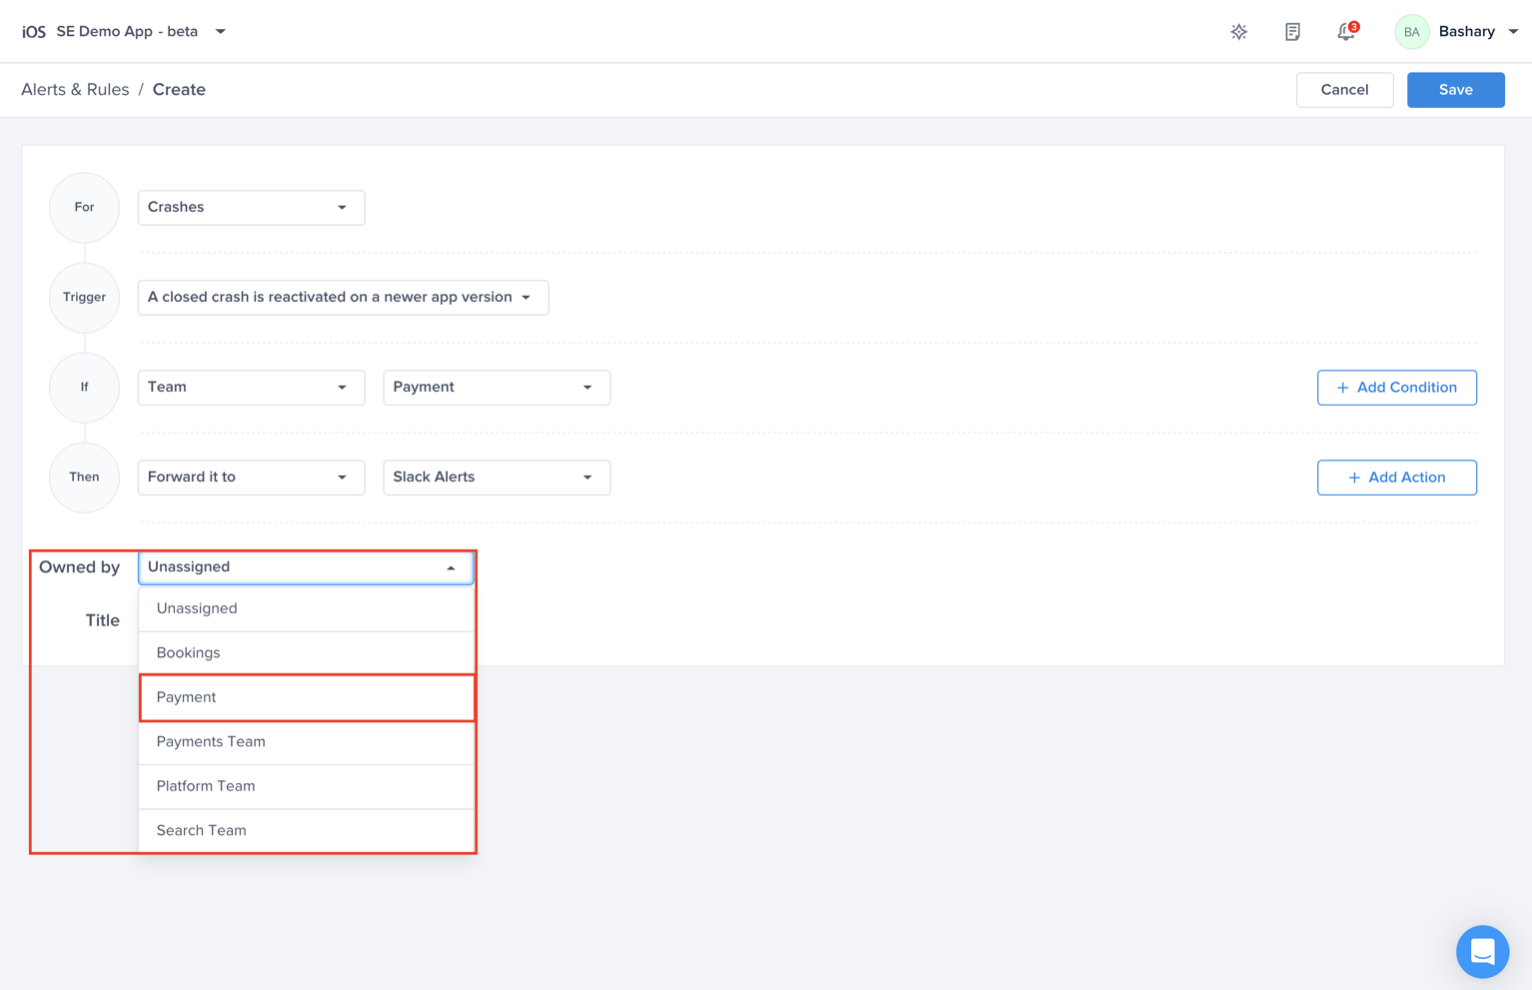
Choose the team that owns this rule

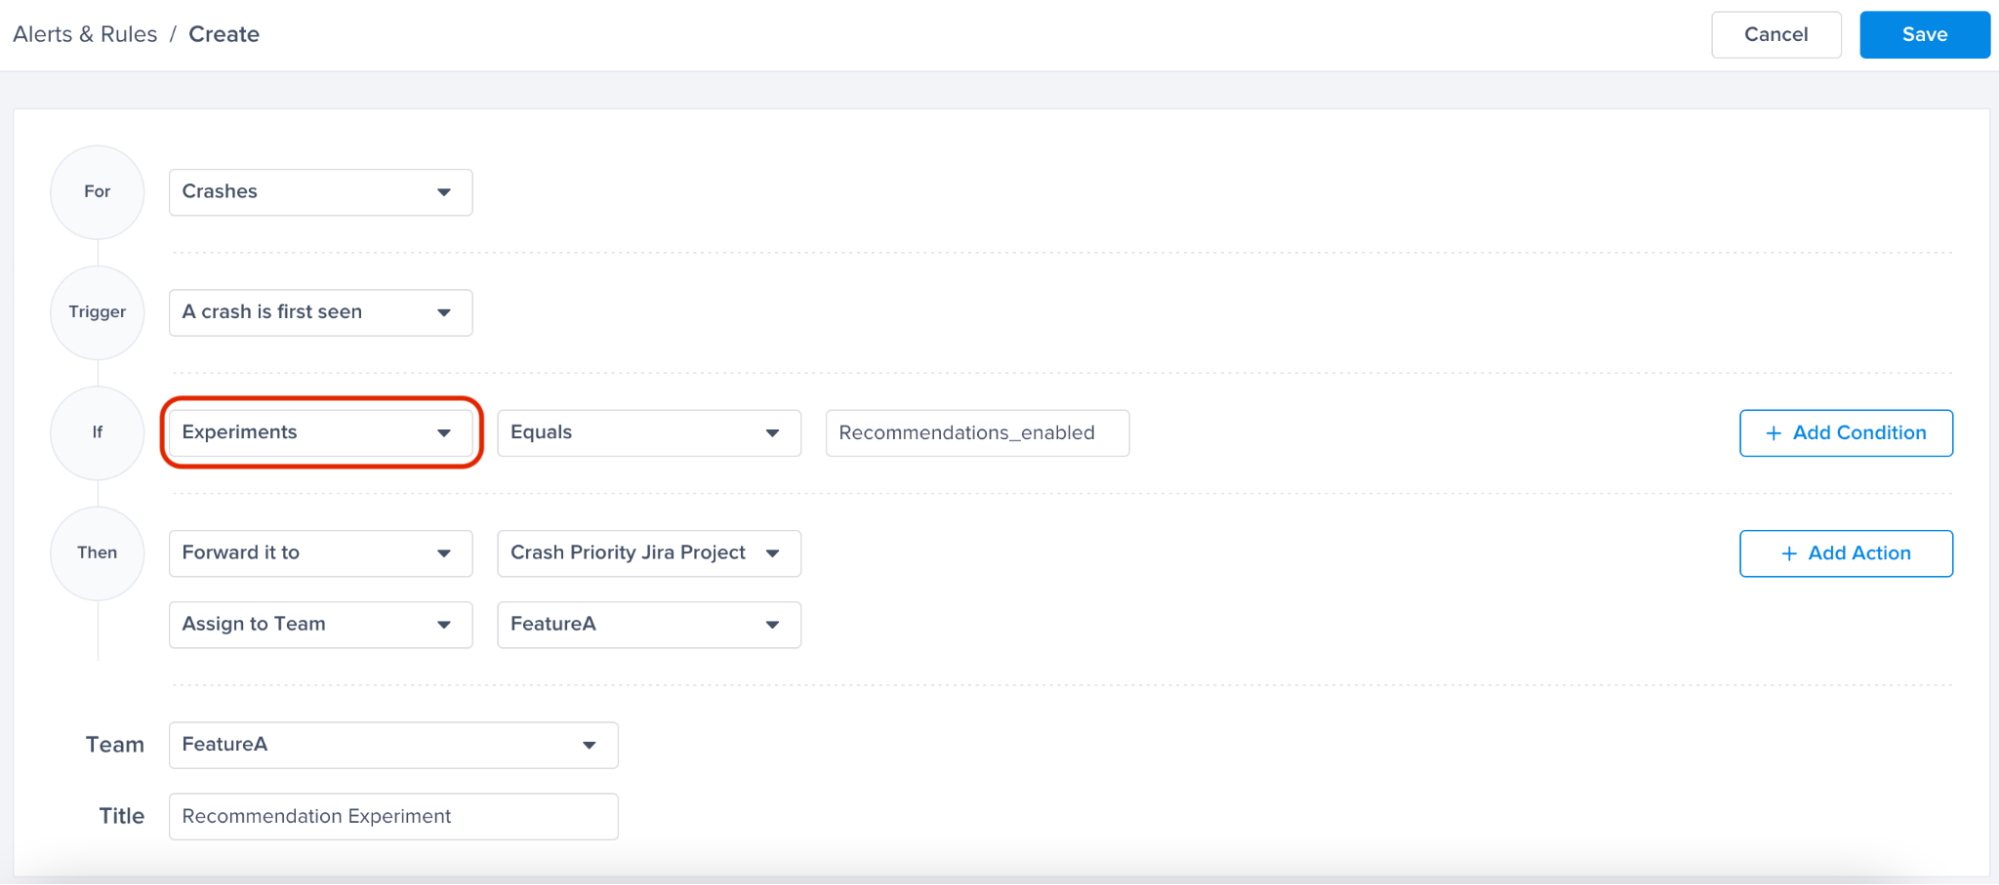
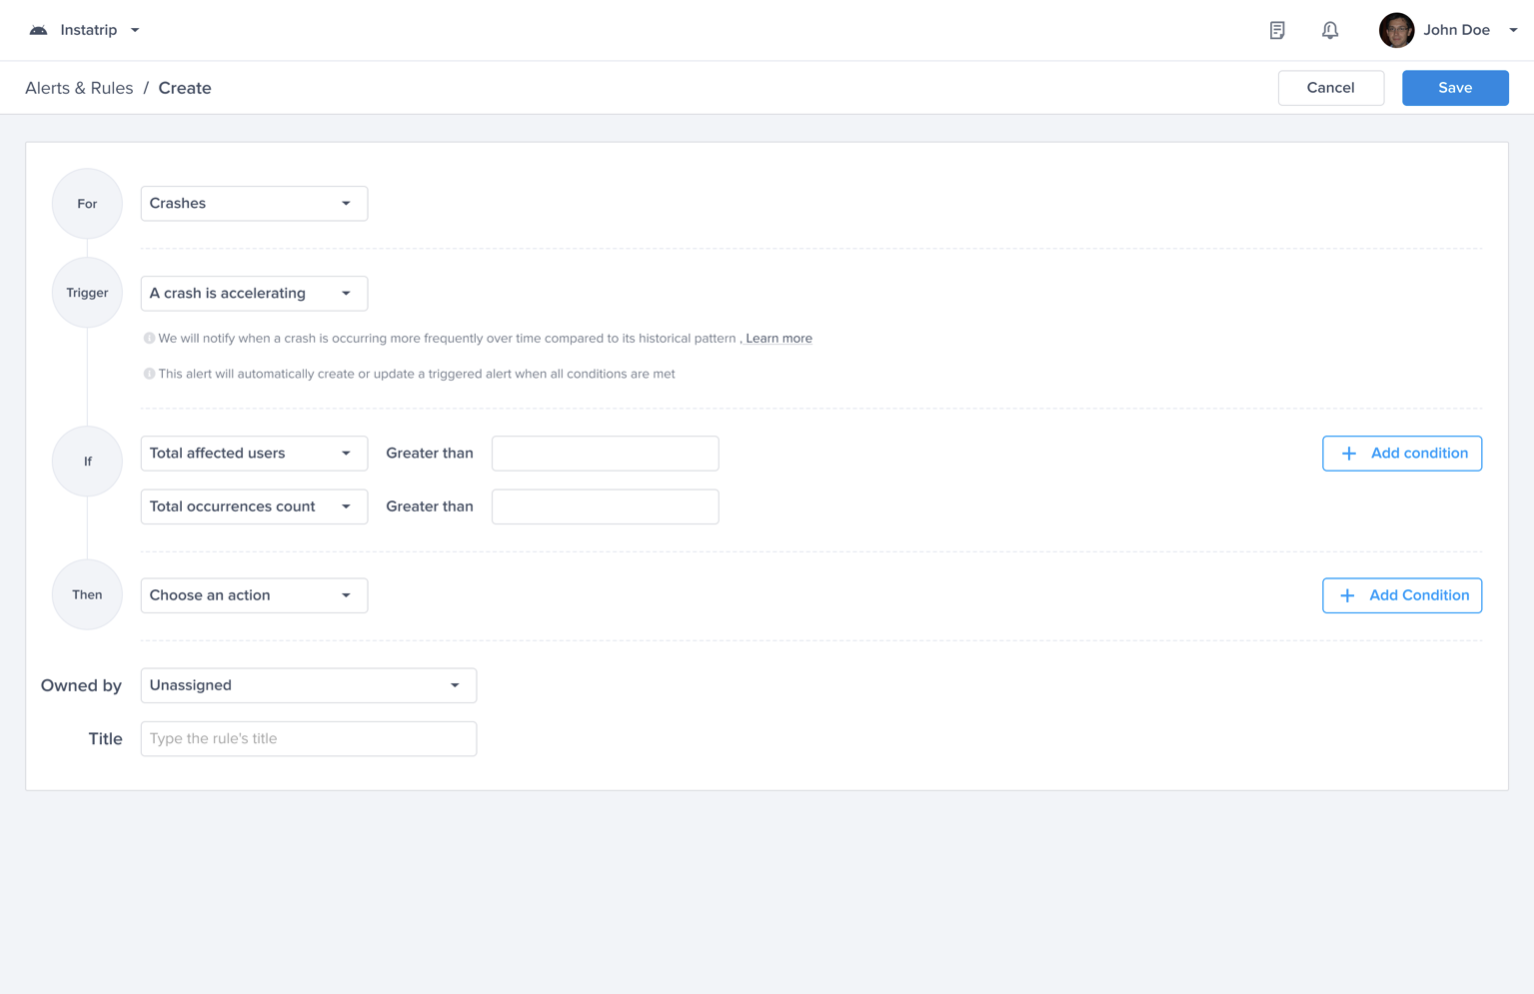
Go to the Alerts & Rules page from the Luciq menu

Click on "Create"
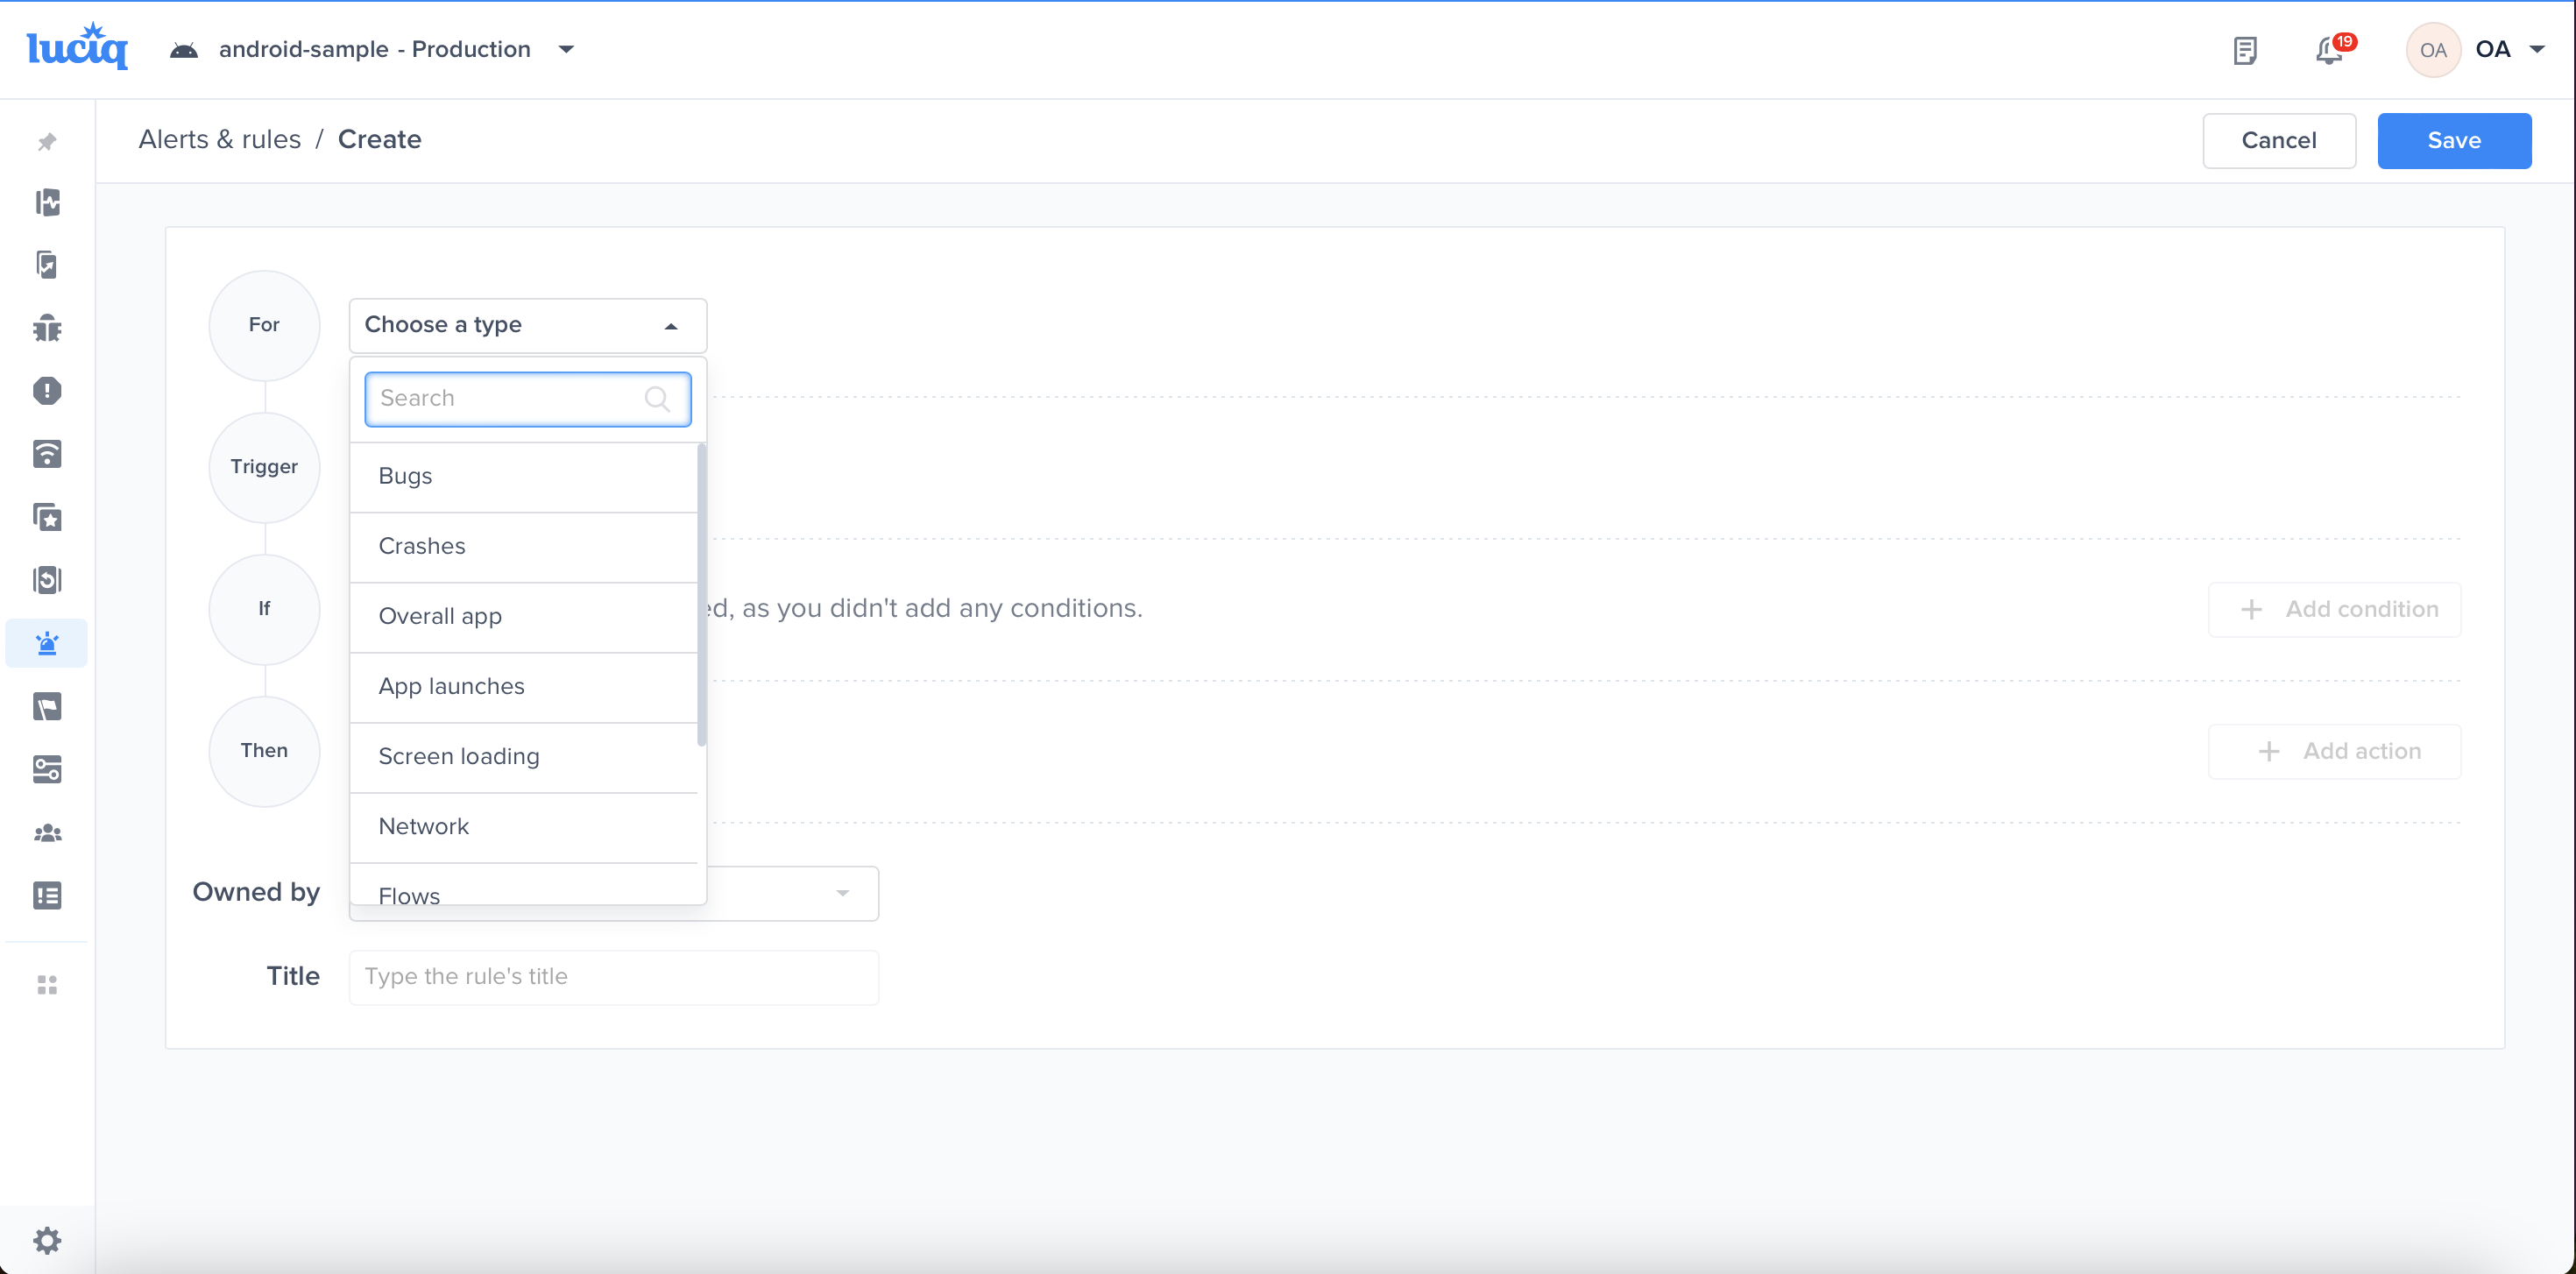
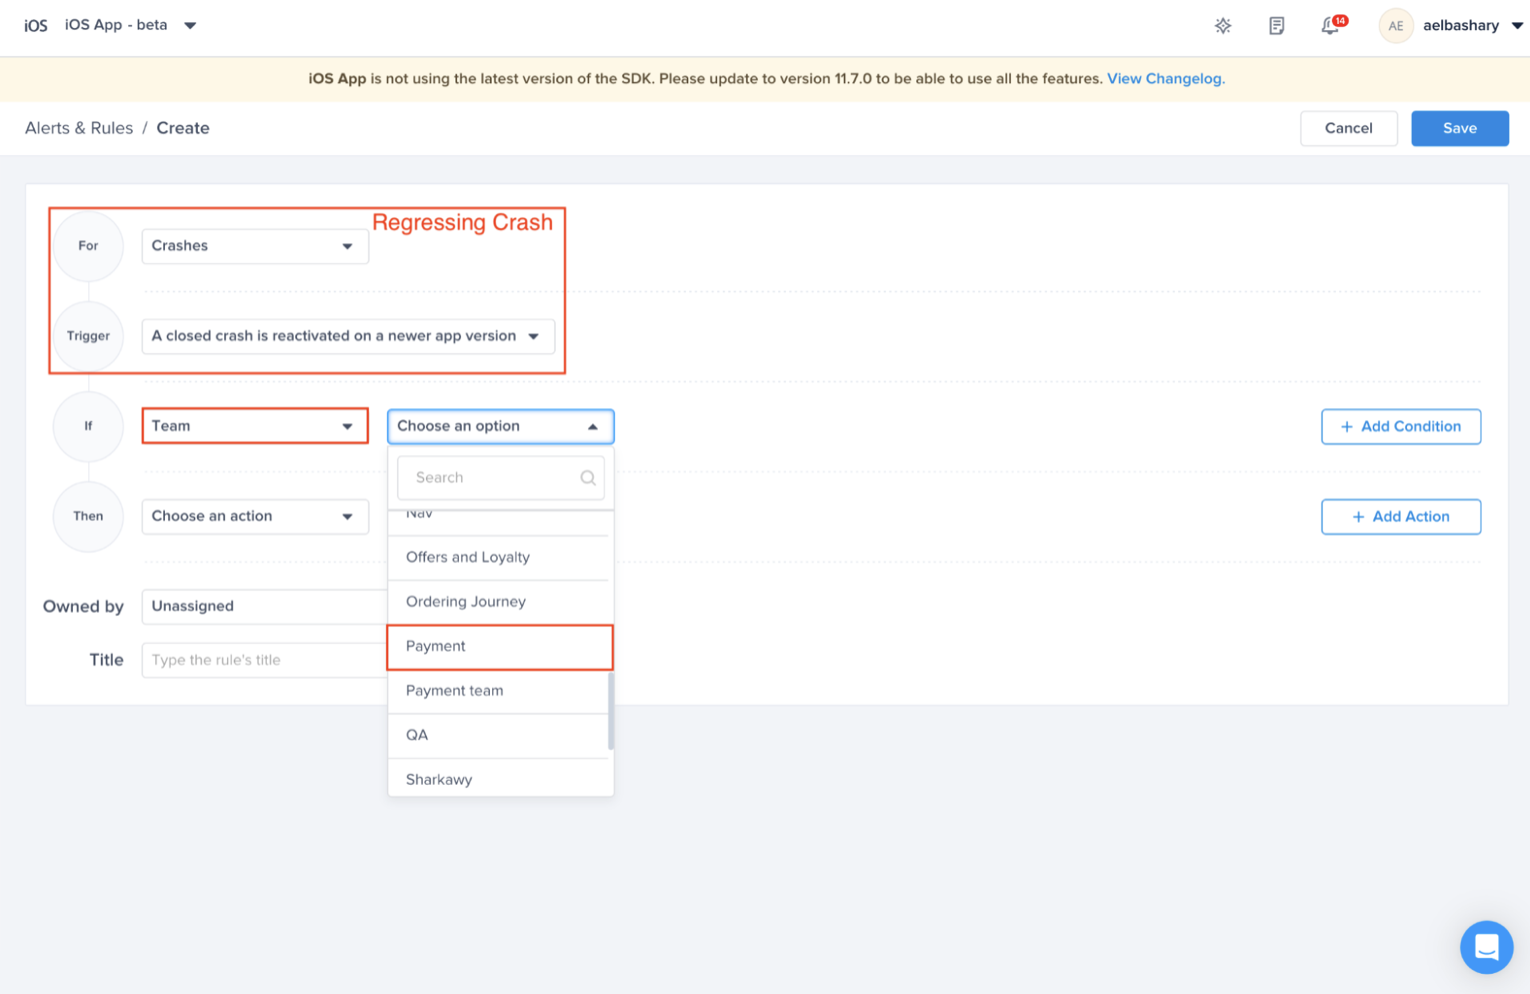
Select "Crashes"
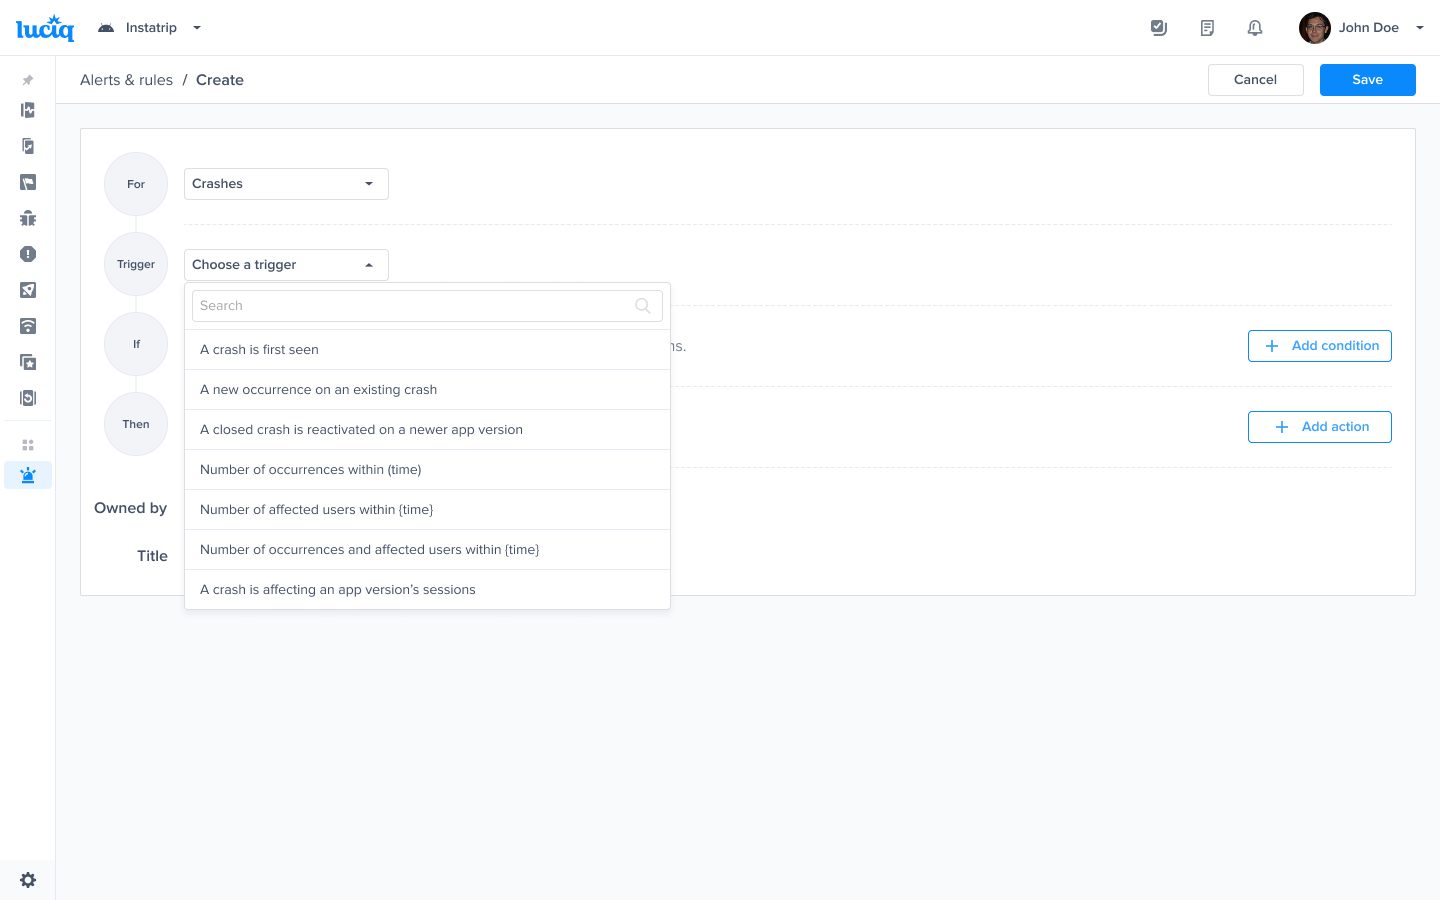
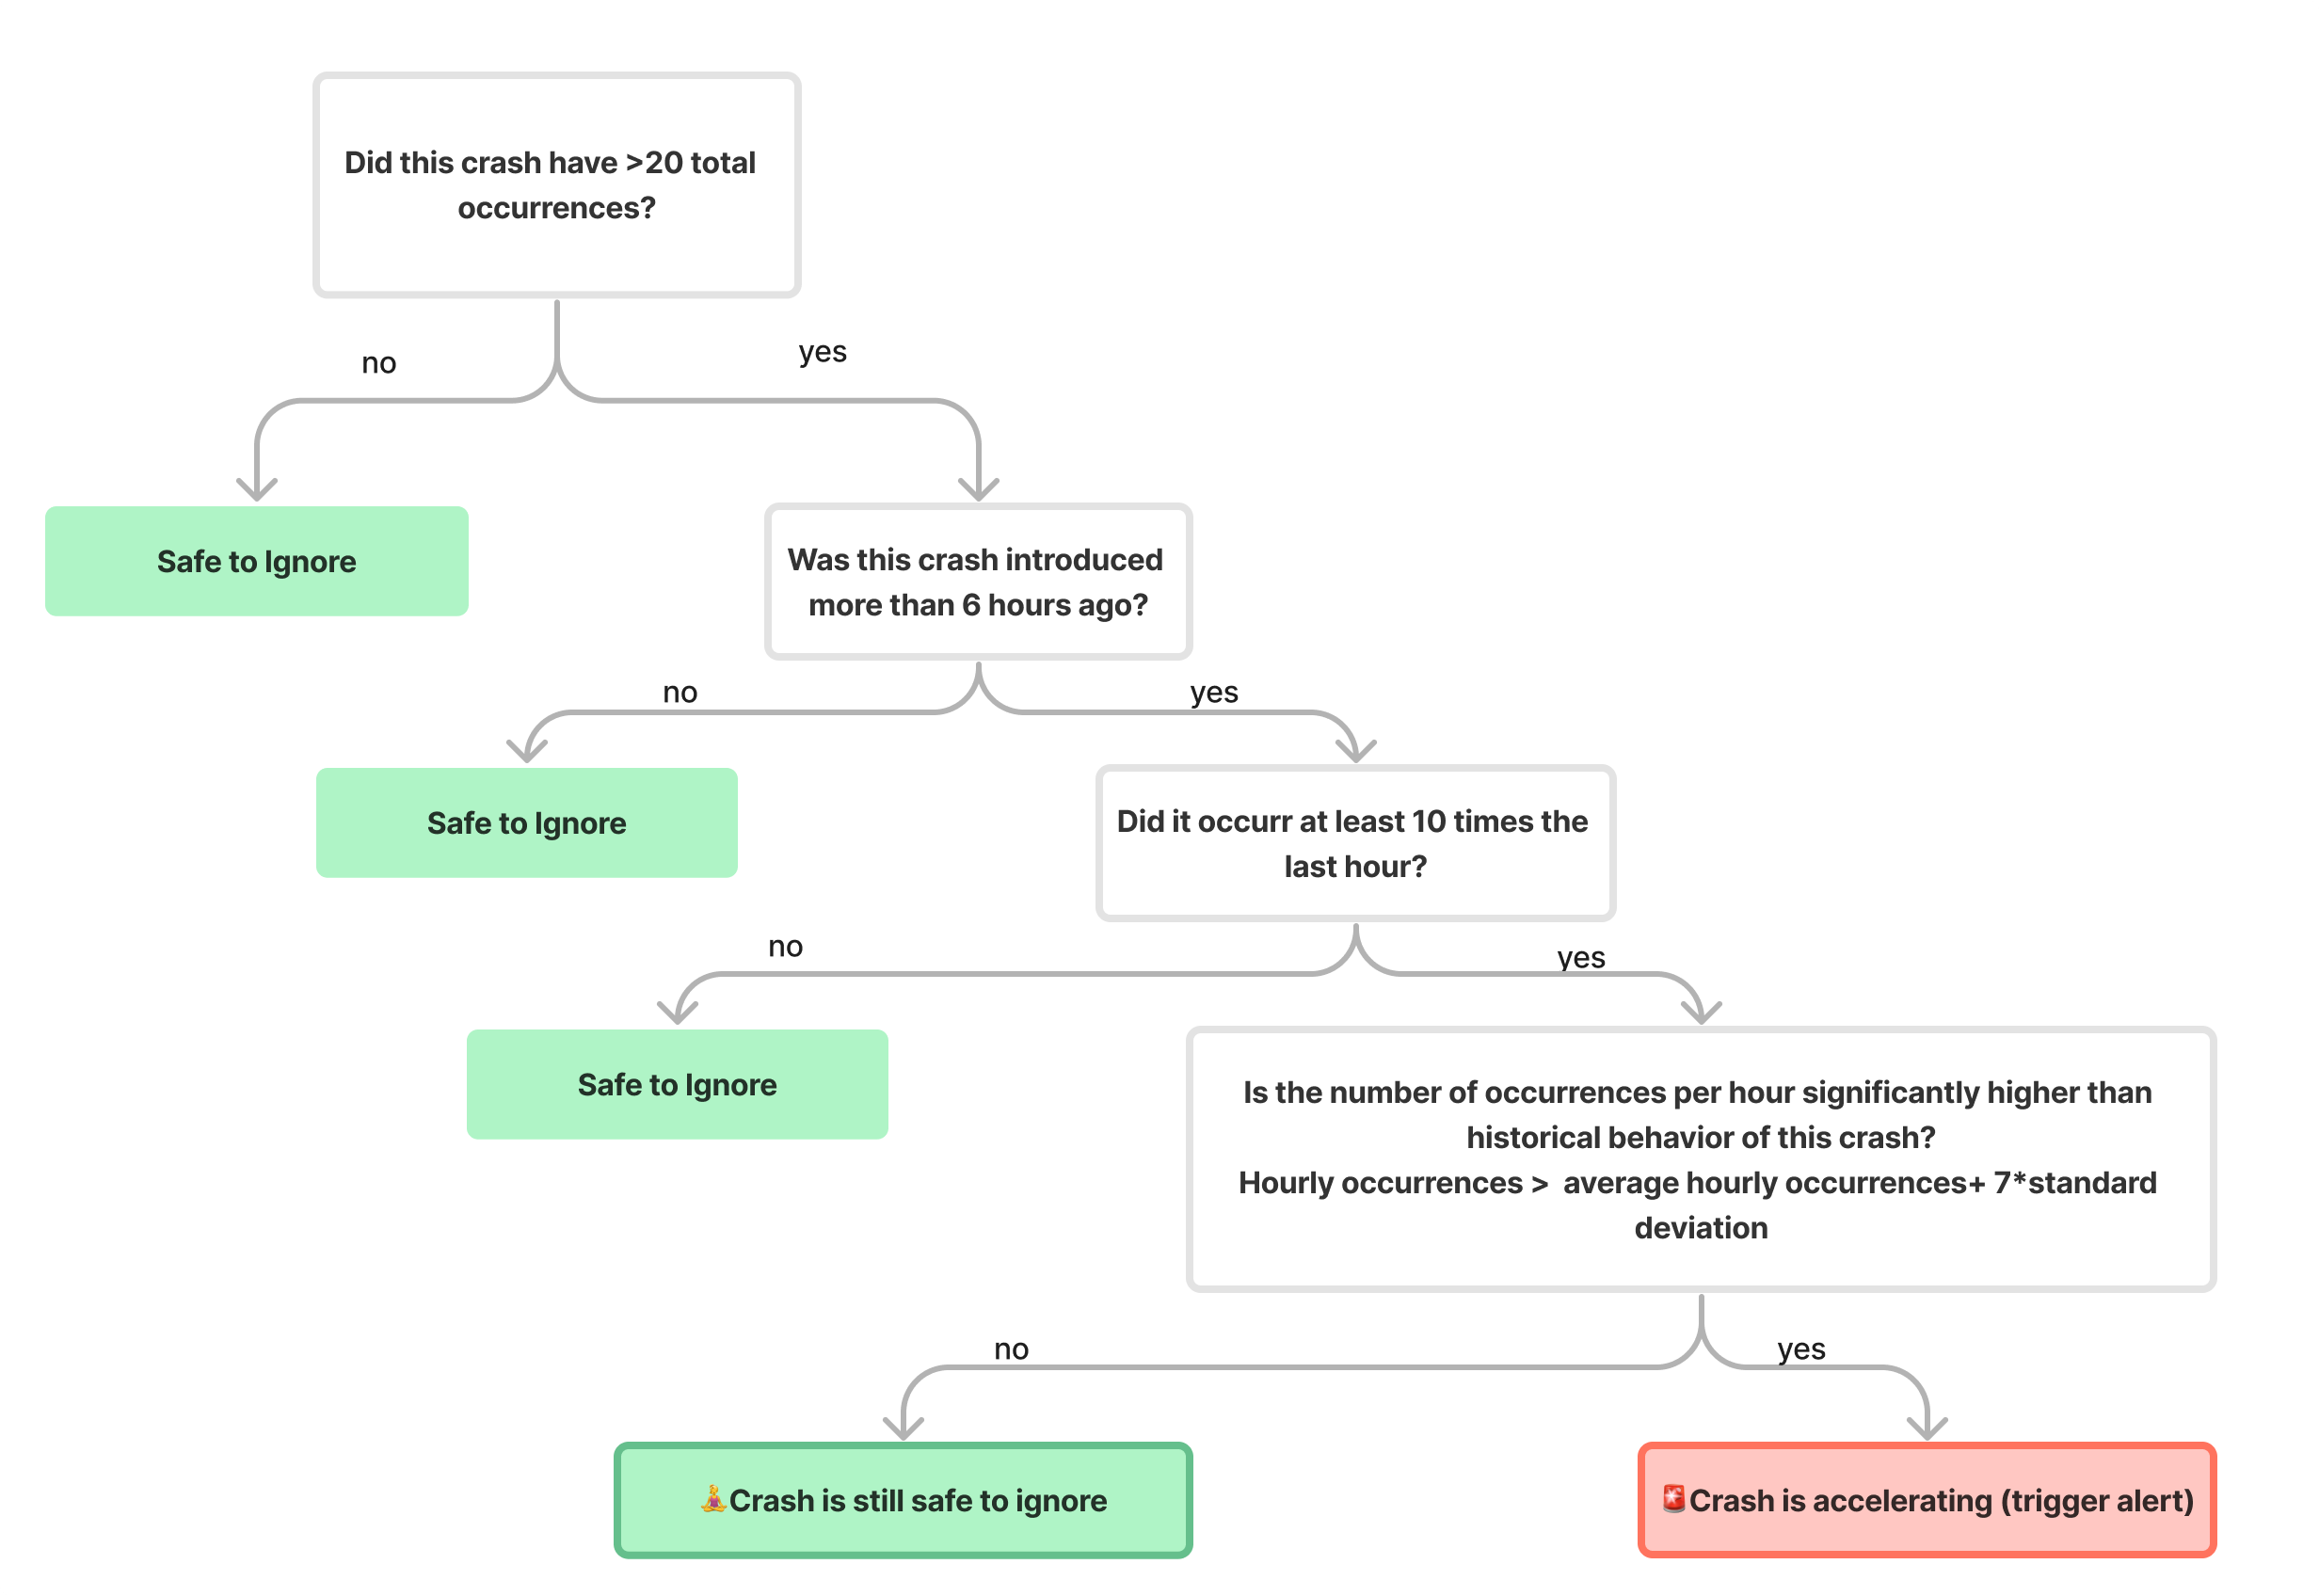
Choose this trigger if you want to be notified as soon as a crash is detected
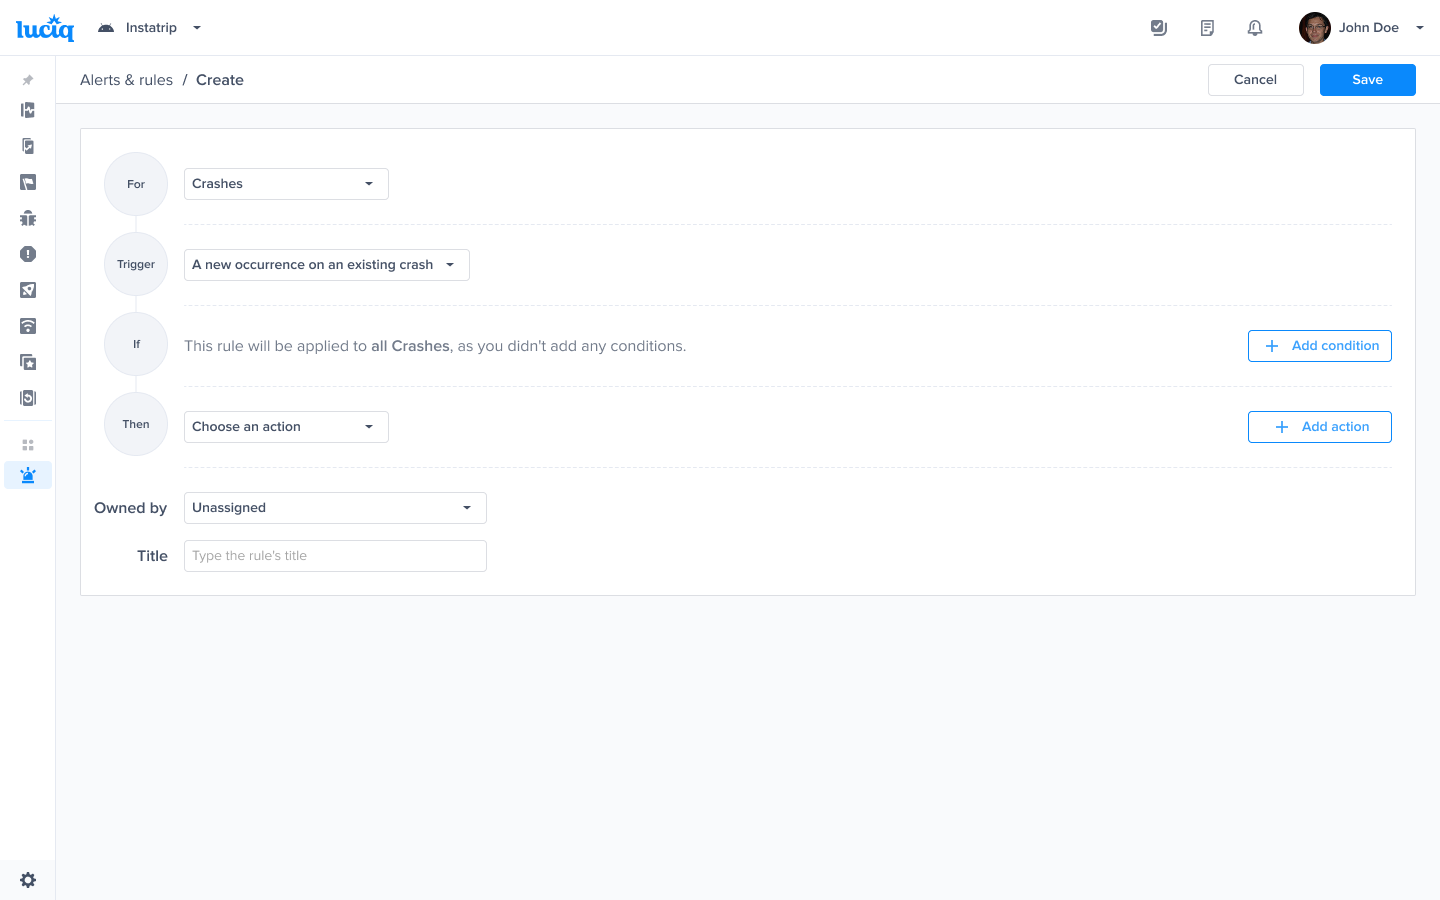
Choose this trigger if you want to be notified as soon as a new occurrence on an existing crash is seen
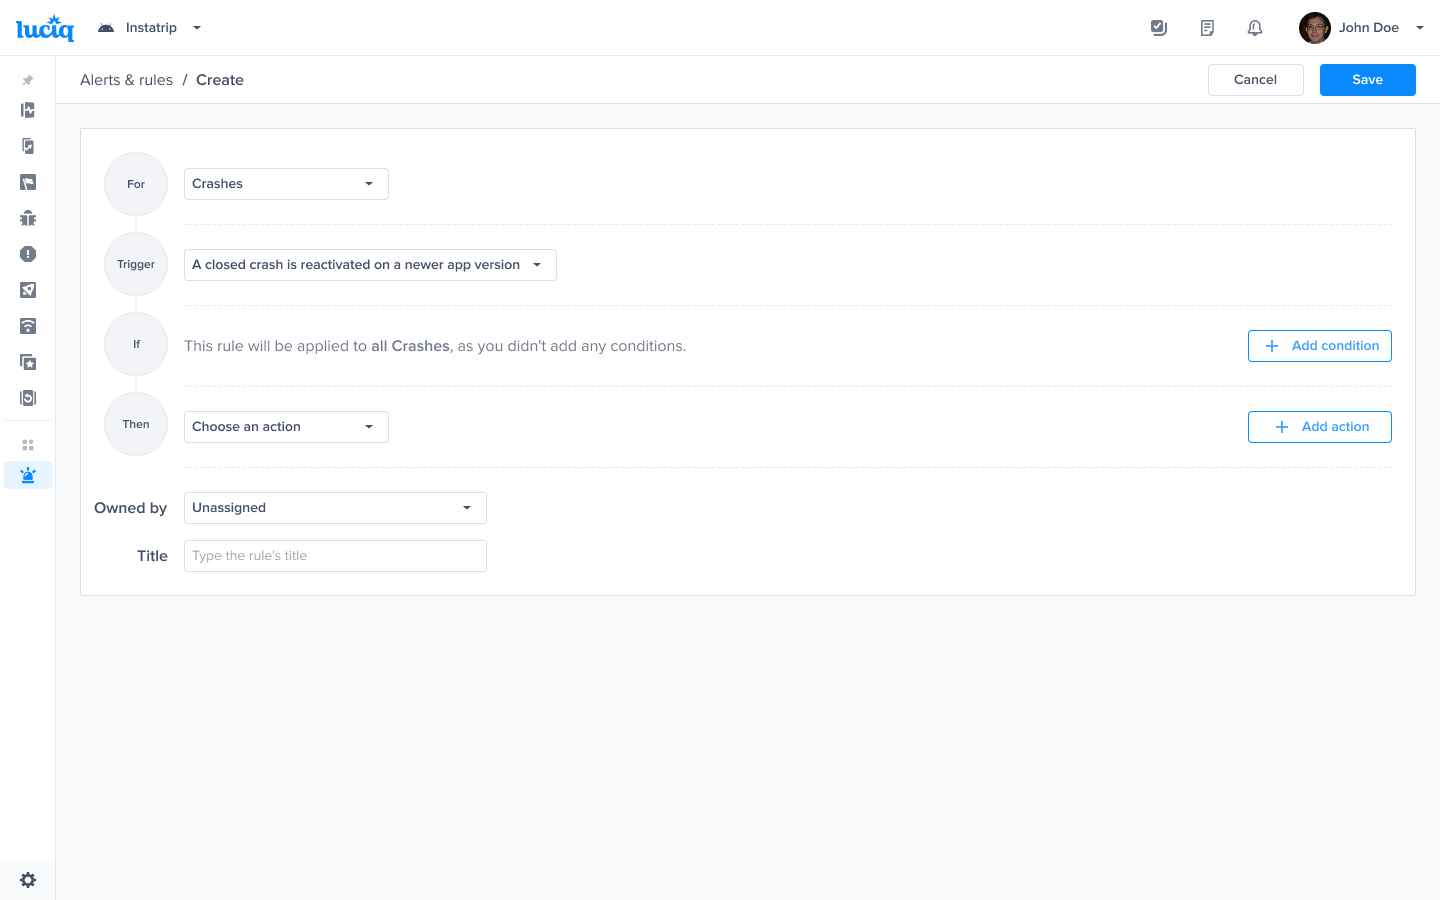
Choose this trigger if you want to be notified as soon as a regression is detected
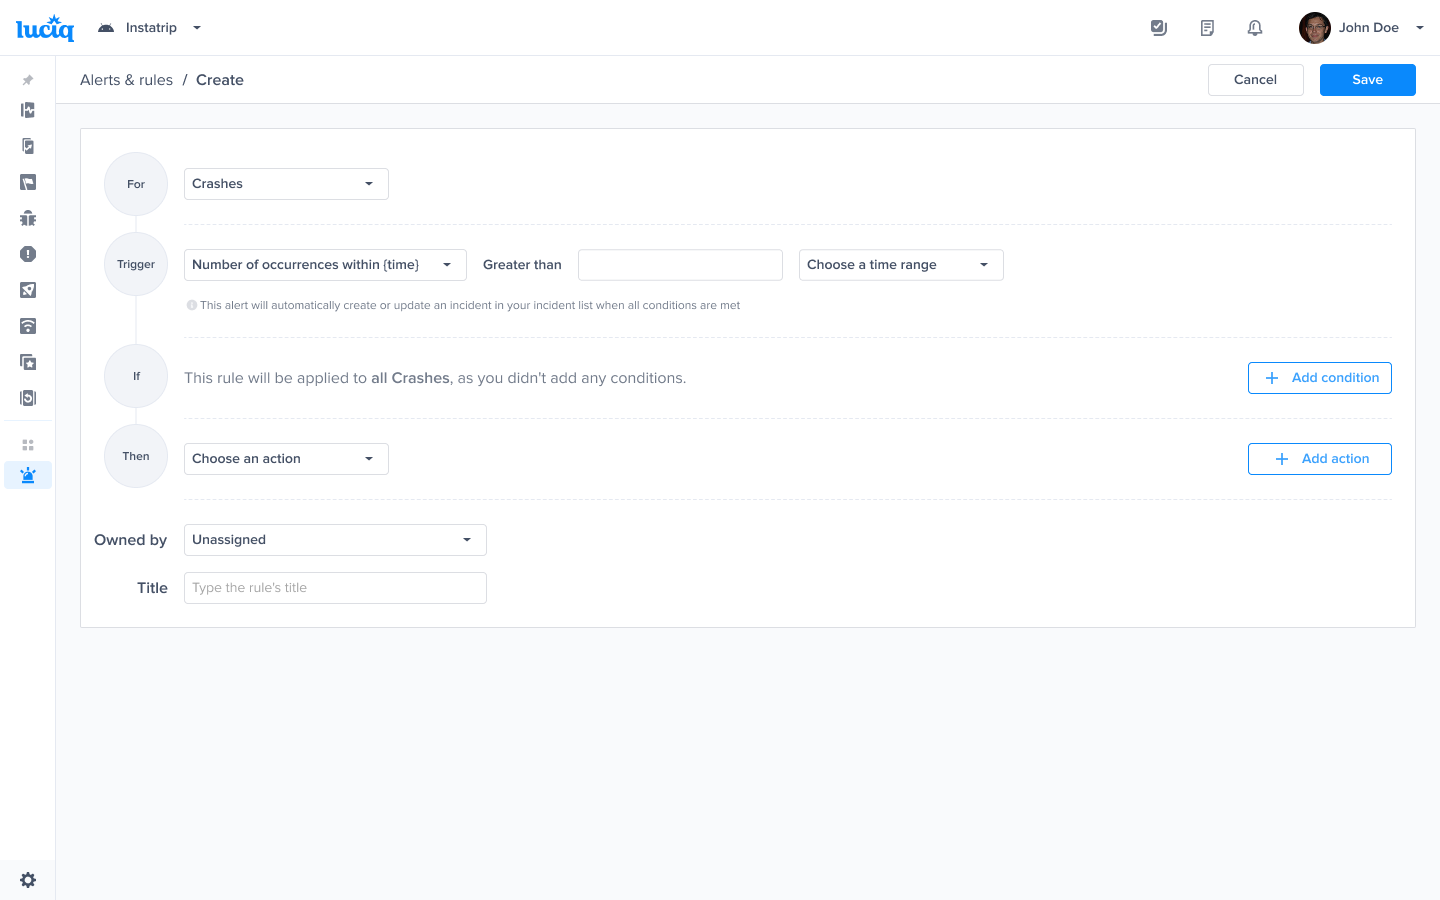
Choose this trigger if you want to be notified as soon as the number of occurrences exceeds a threshold
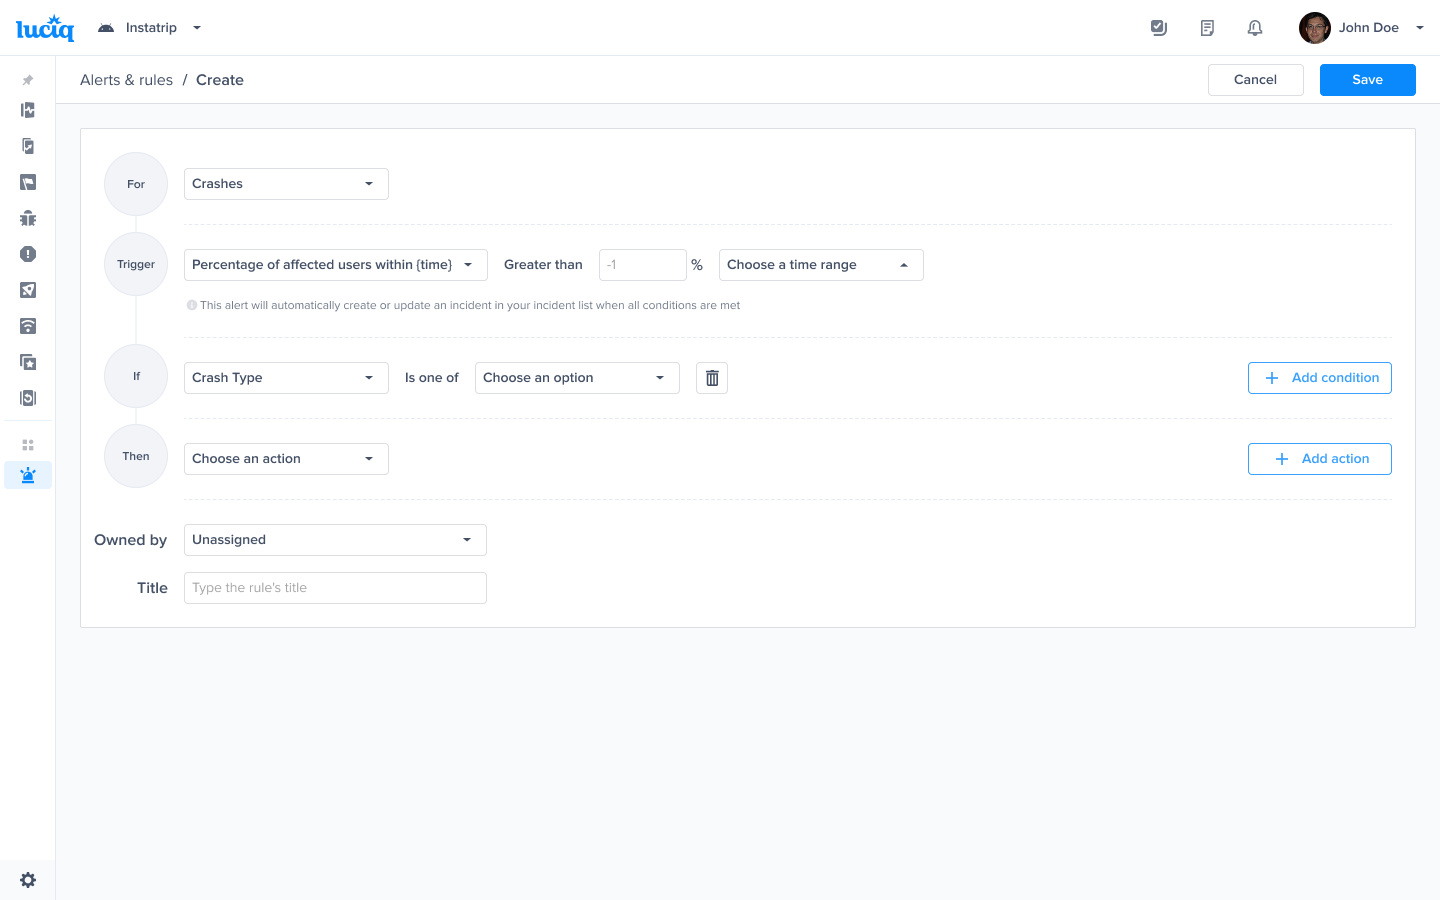
Choose this trigger if you want to be notified as soon as the number of affected users exceeds a threshold
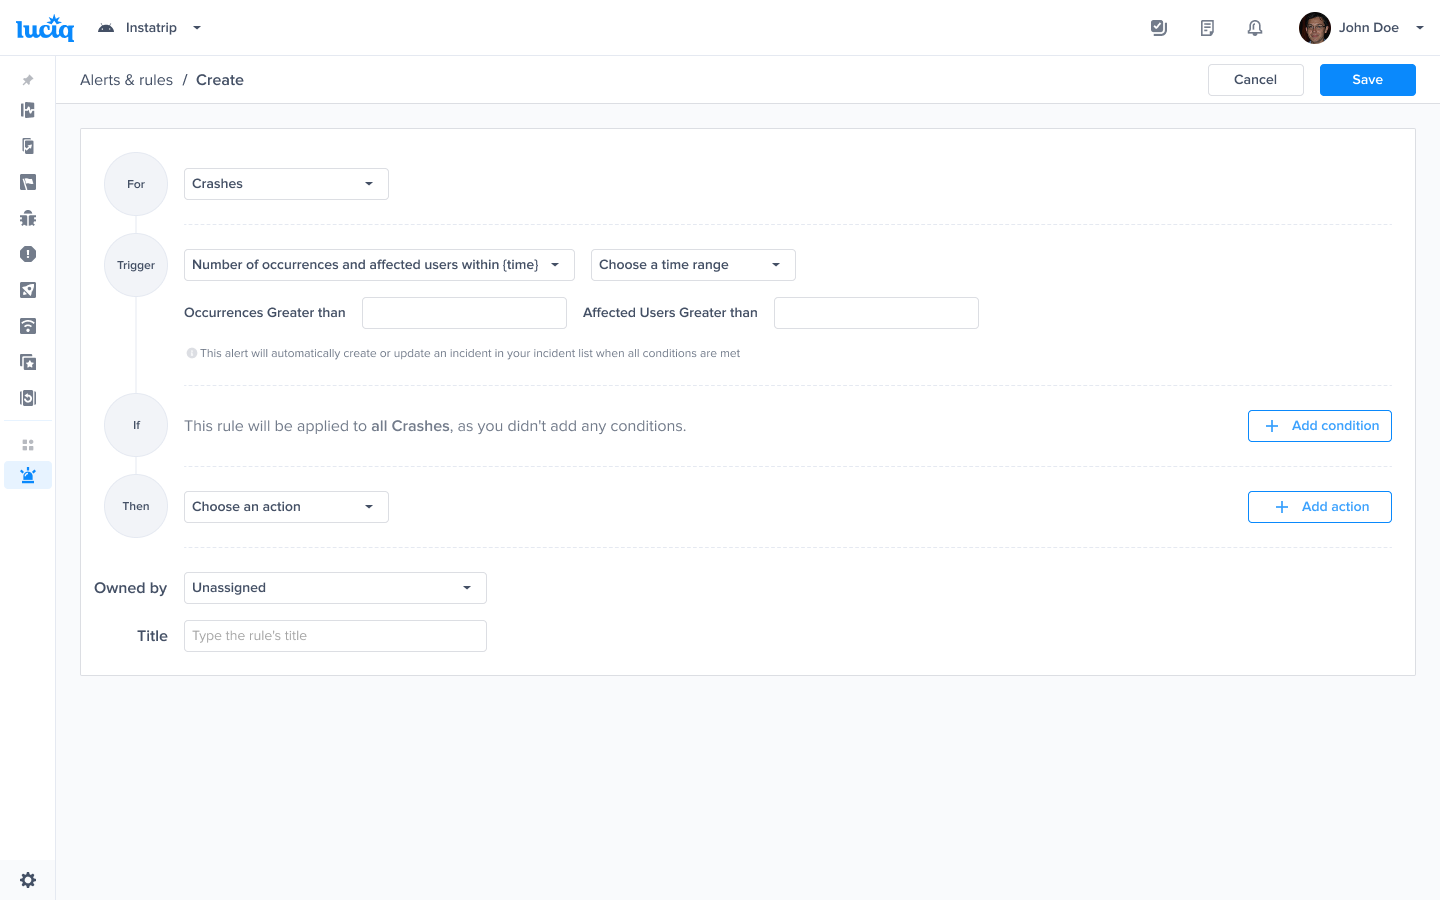
Choose this trigger if you want to be notified as soon as the number of occurrences and the number of effected users exceed a threshold
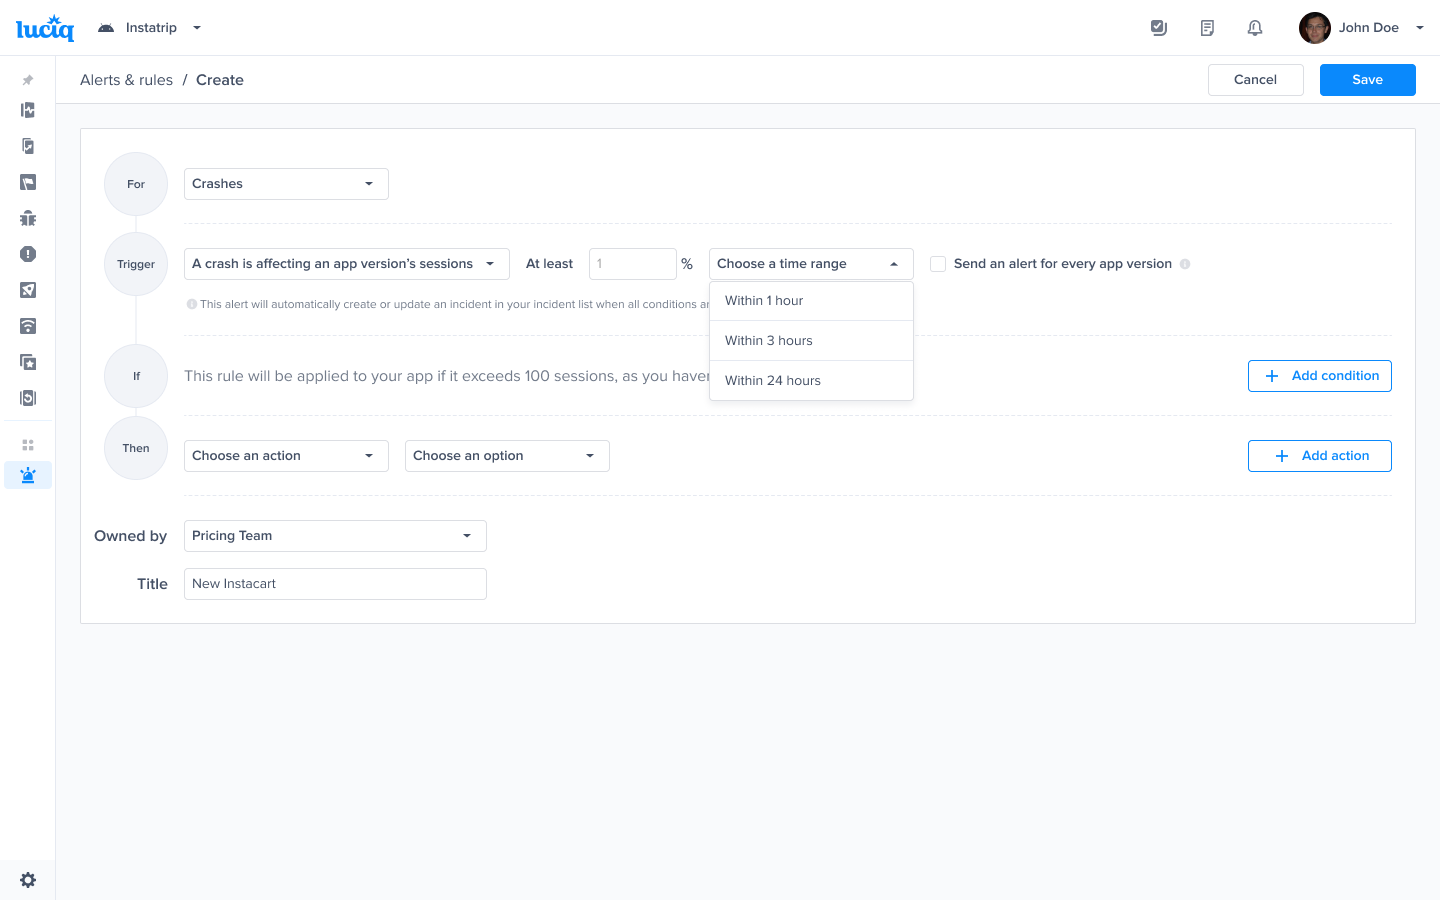
Choose this trigger if you want to be notified as soon as a crash affects at least 1% of an app version's sessions in the last 24 hours
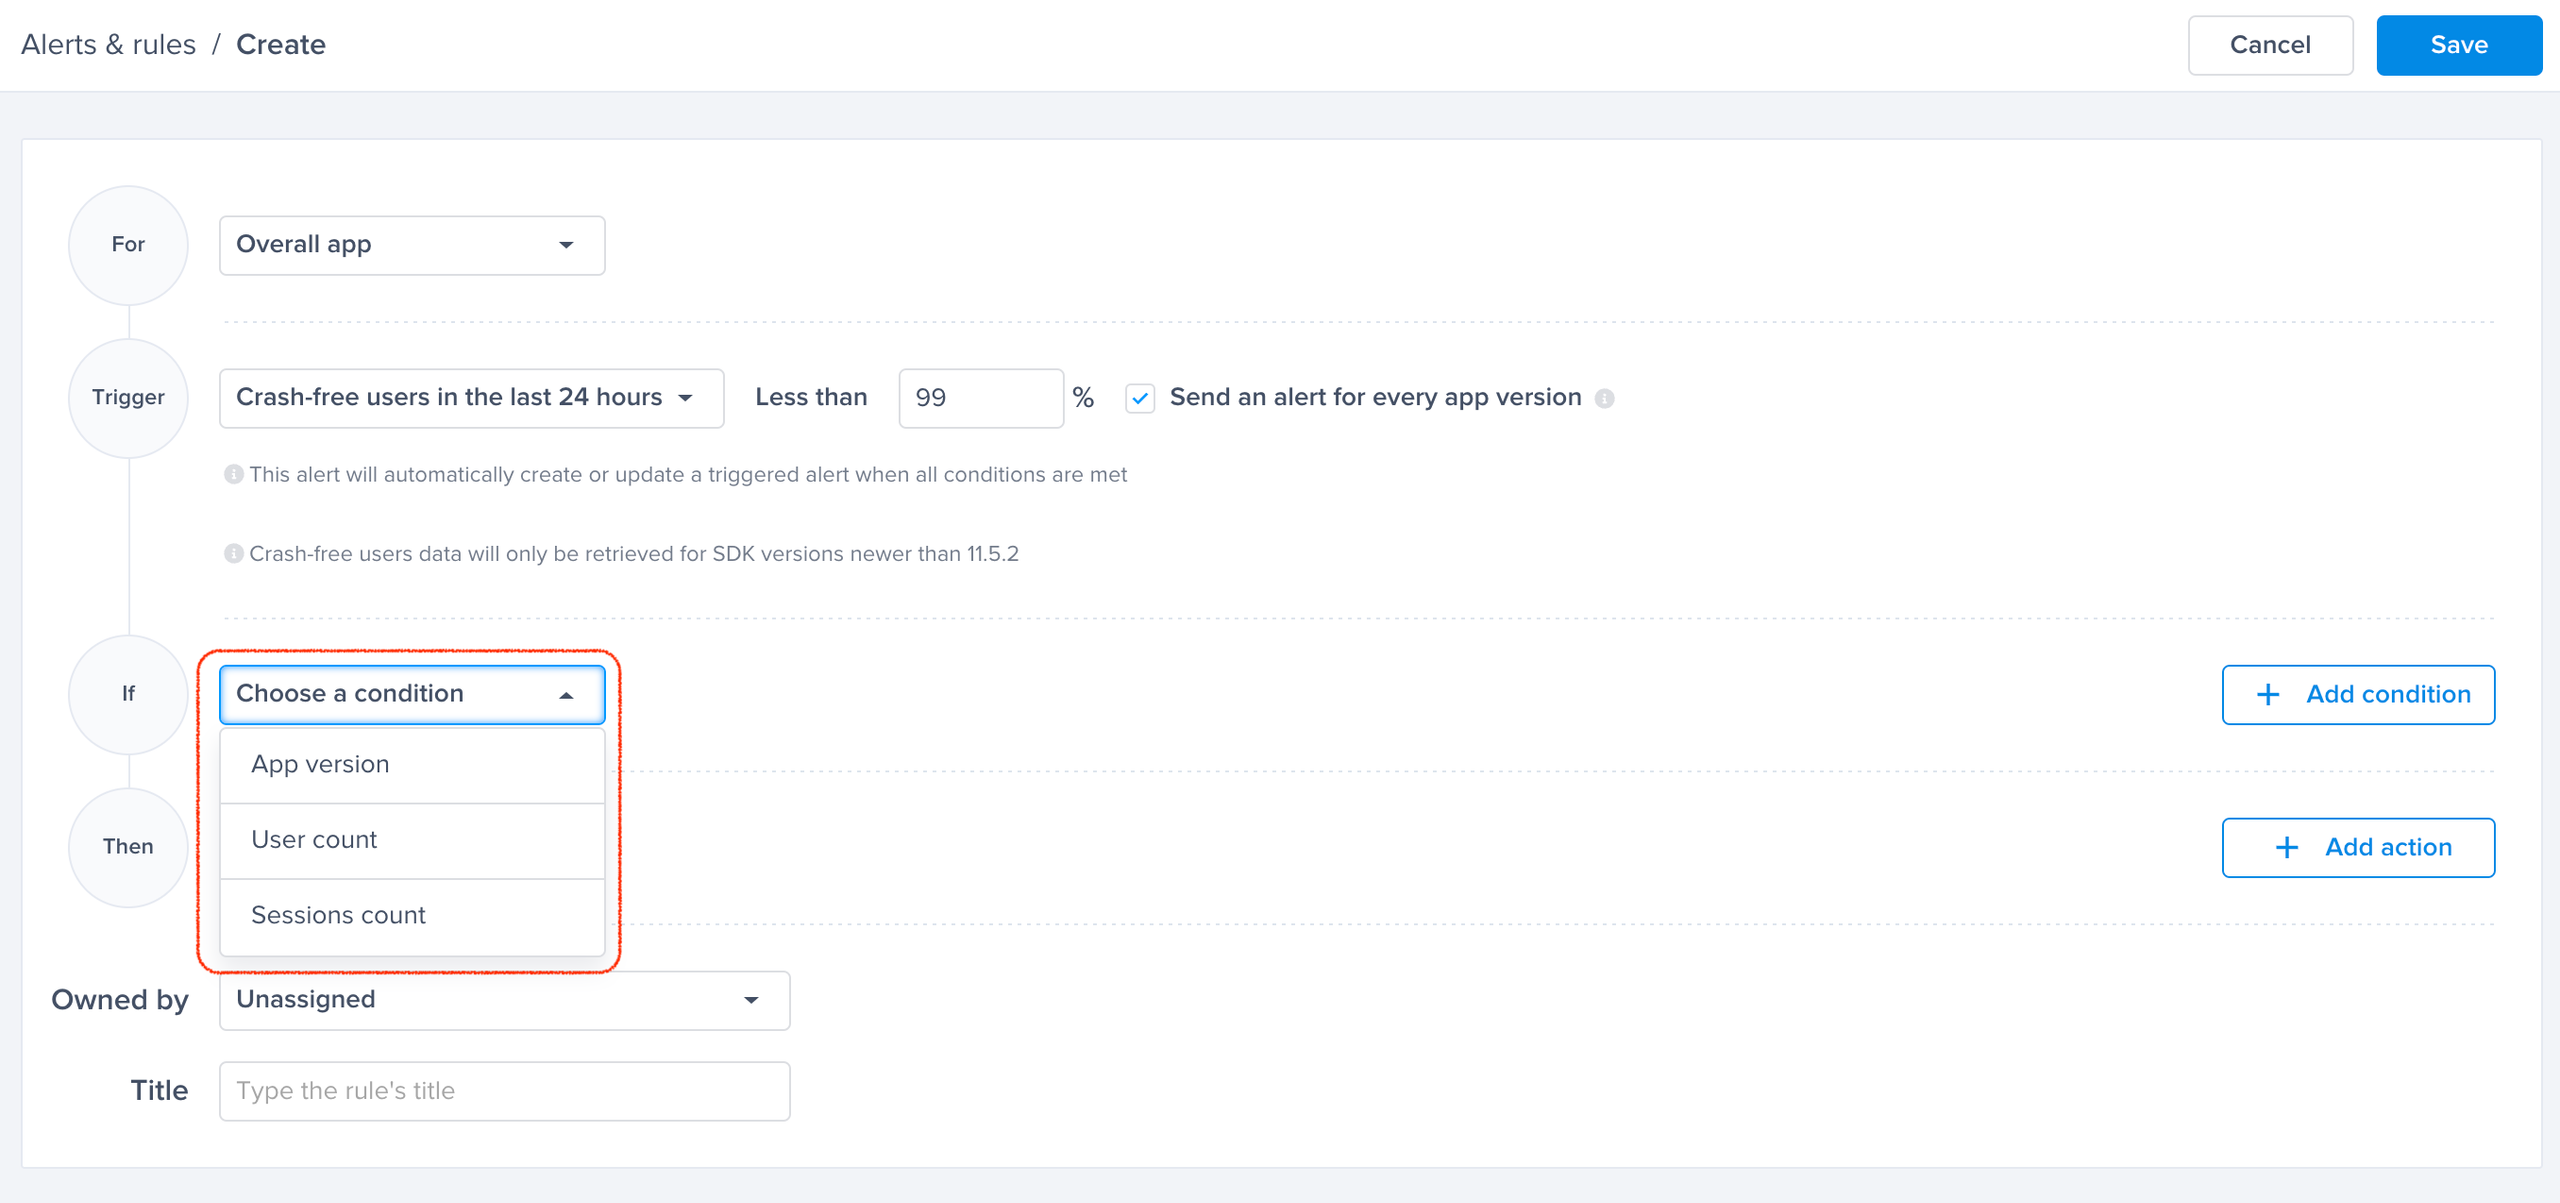
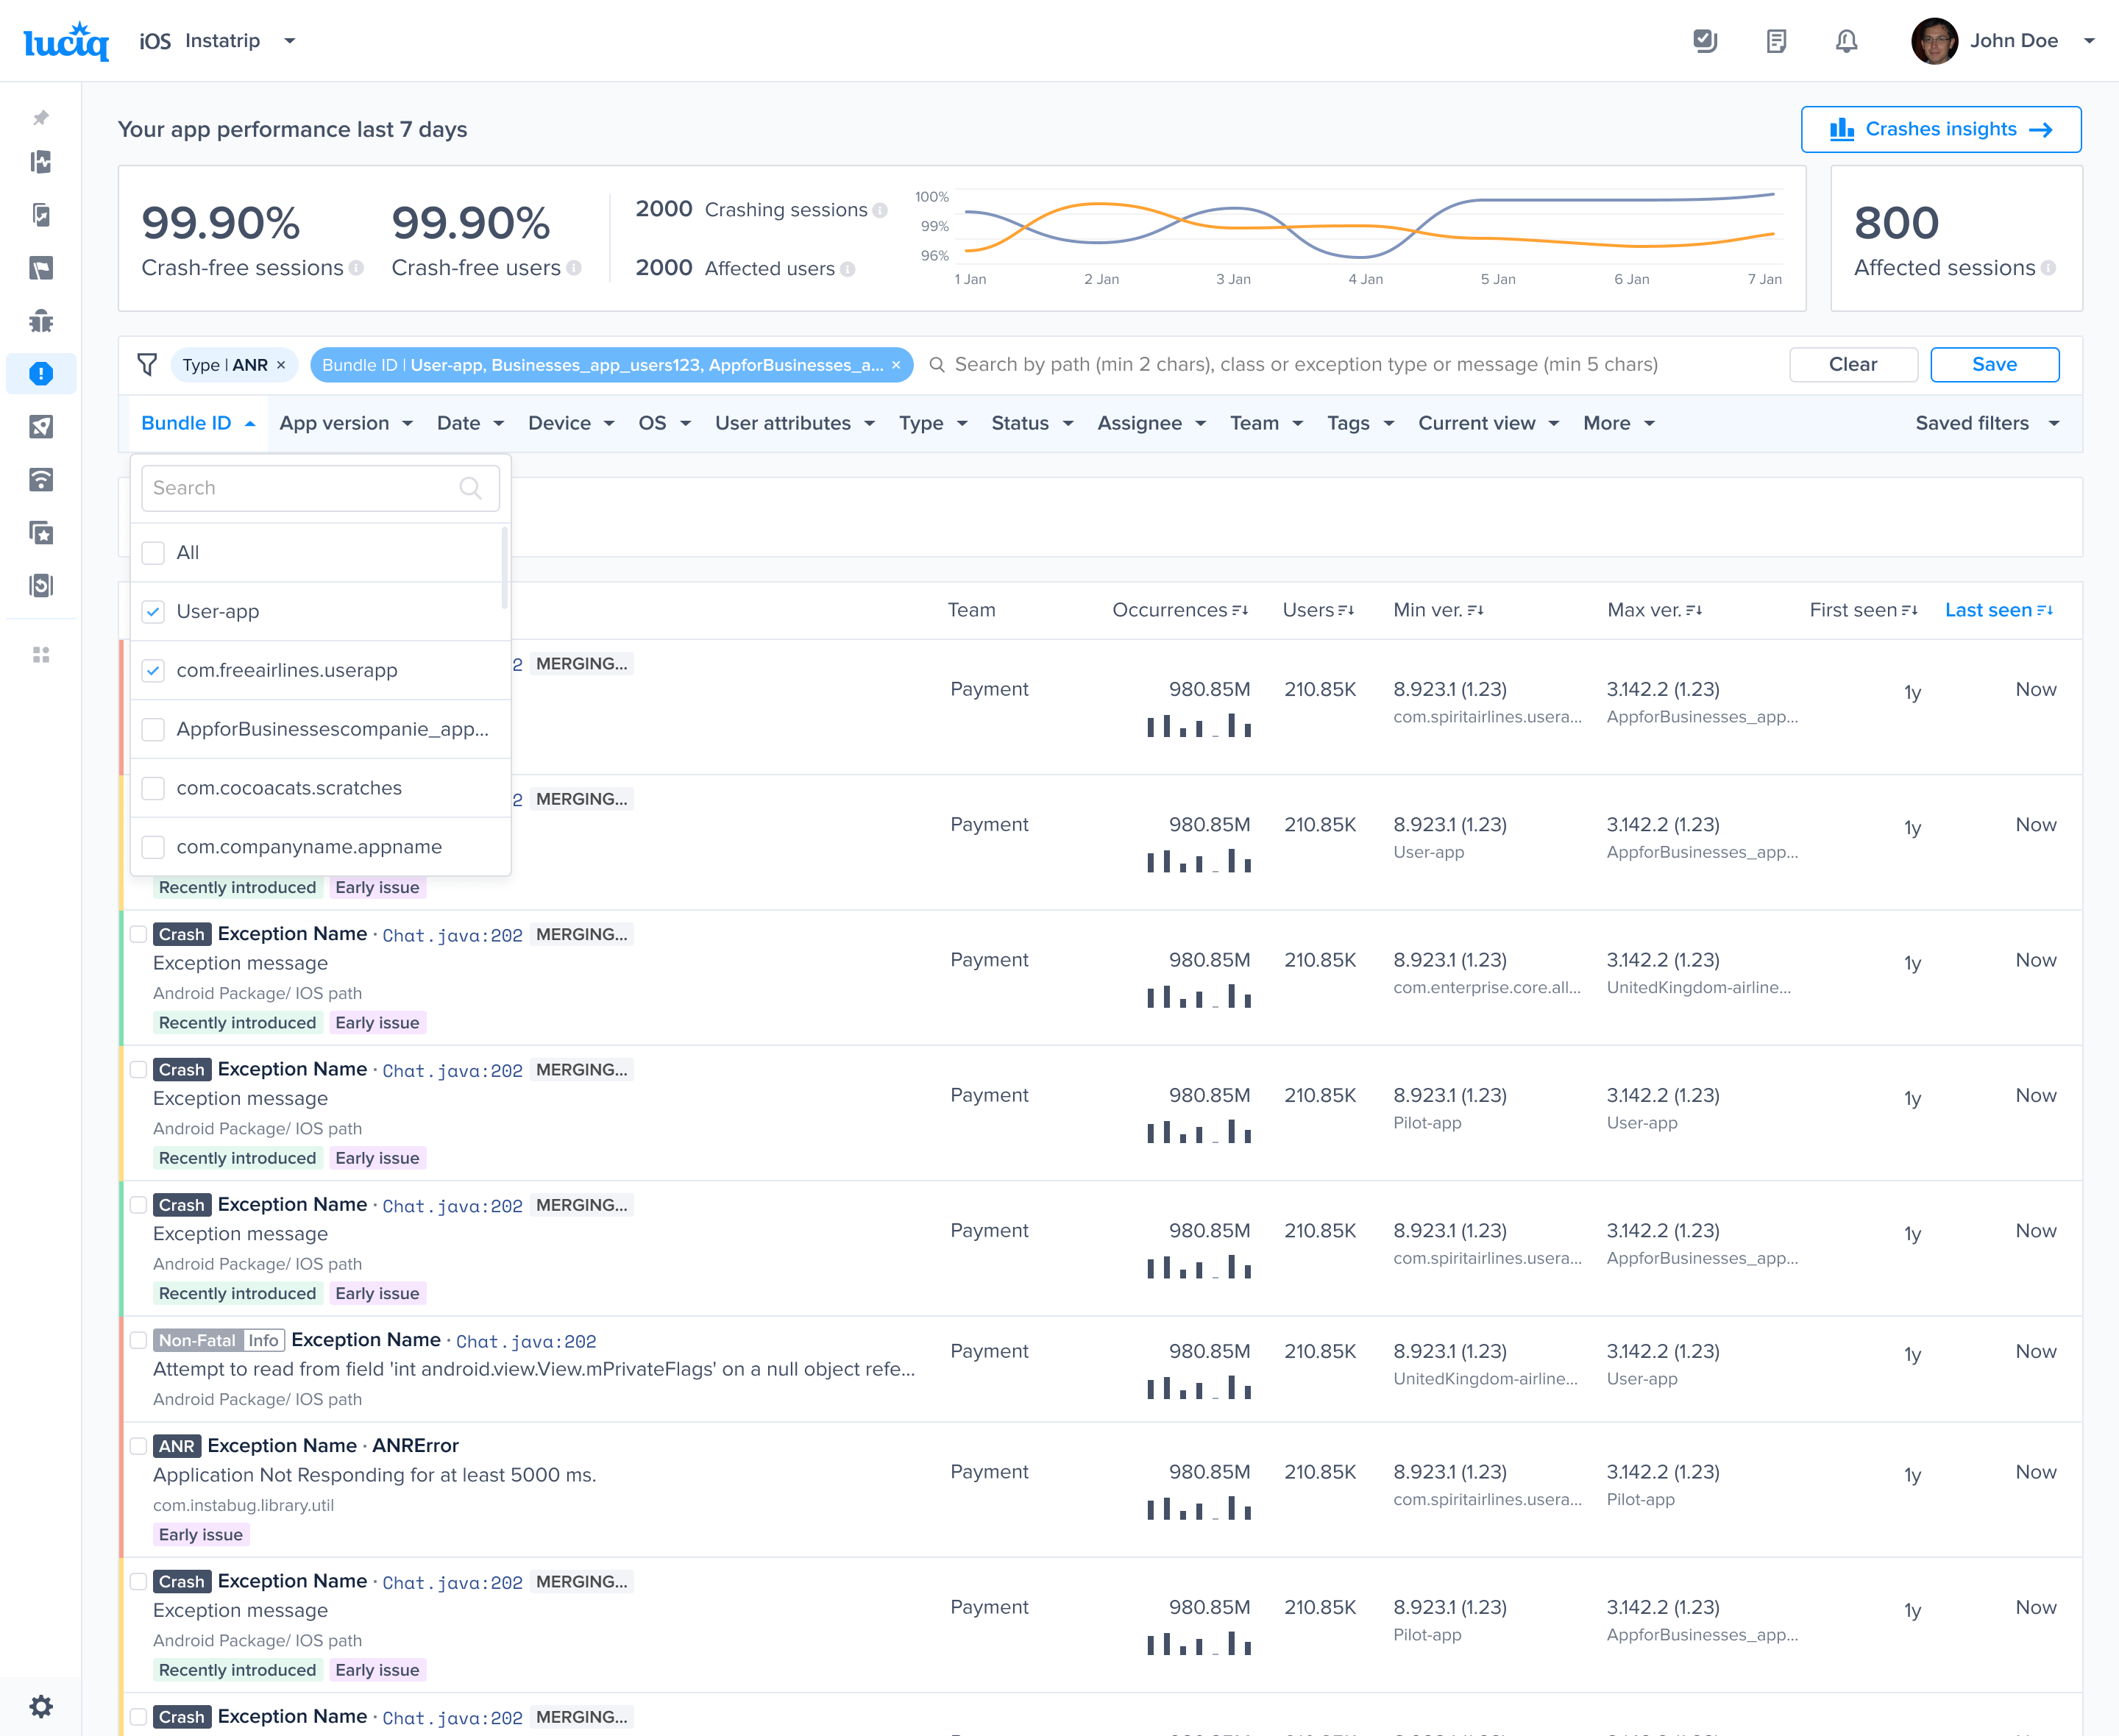
A list of conditions that you can choose from to have finer control over your alerts
Go to the Alerts & Rules page from the Luciq menu
Click on "Create"
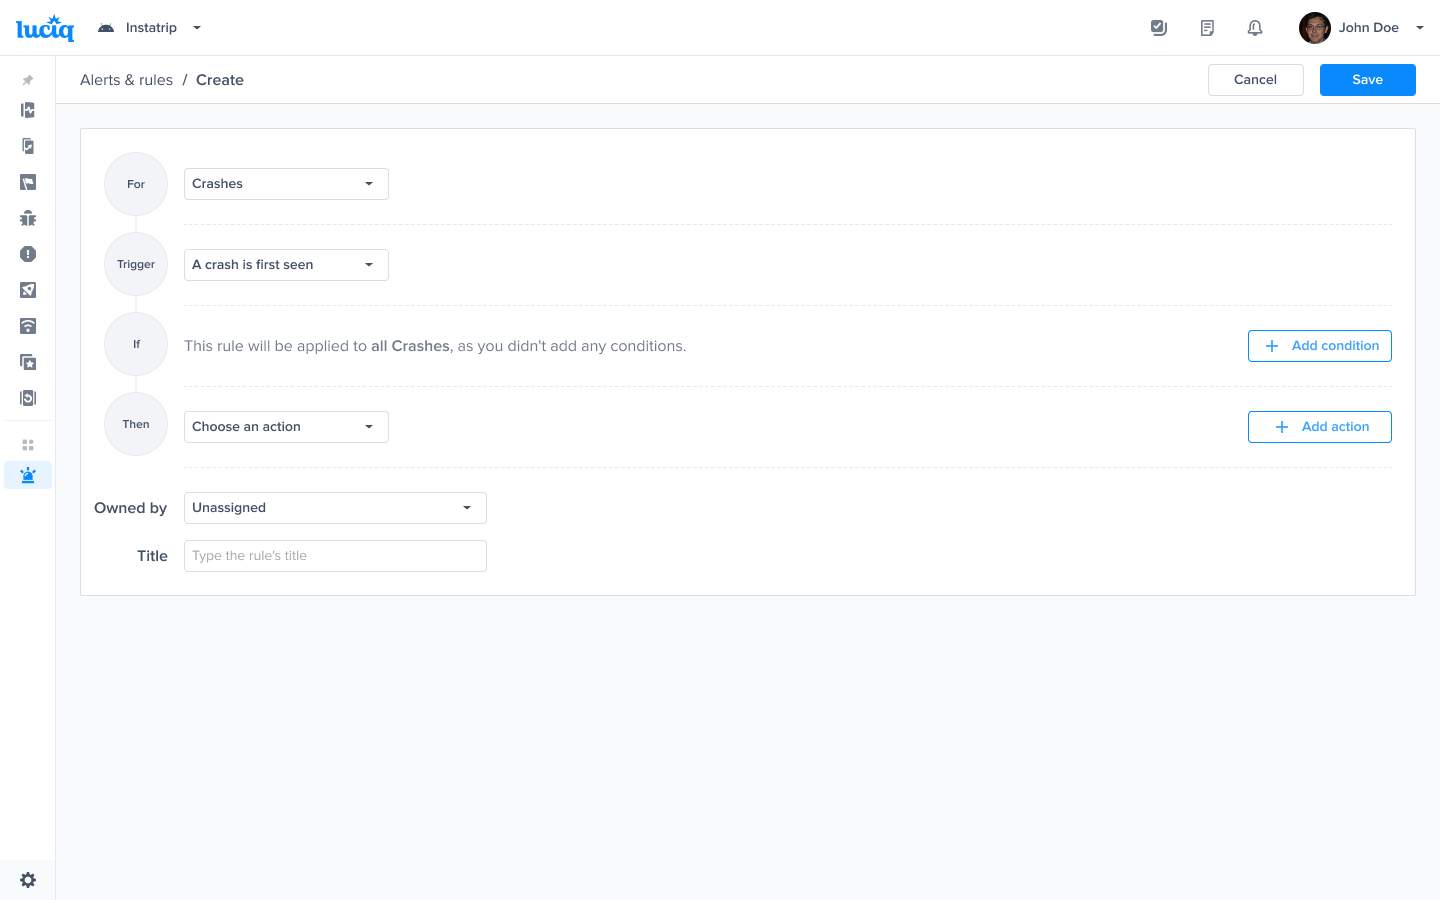
Select "Crashes"
Choose a Trigger
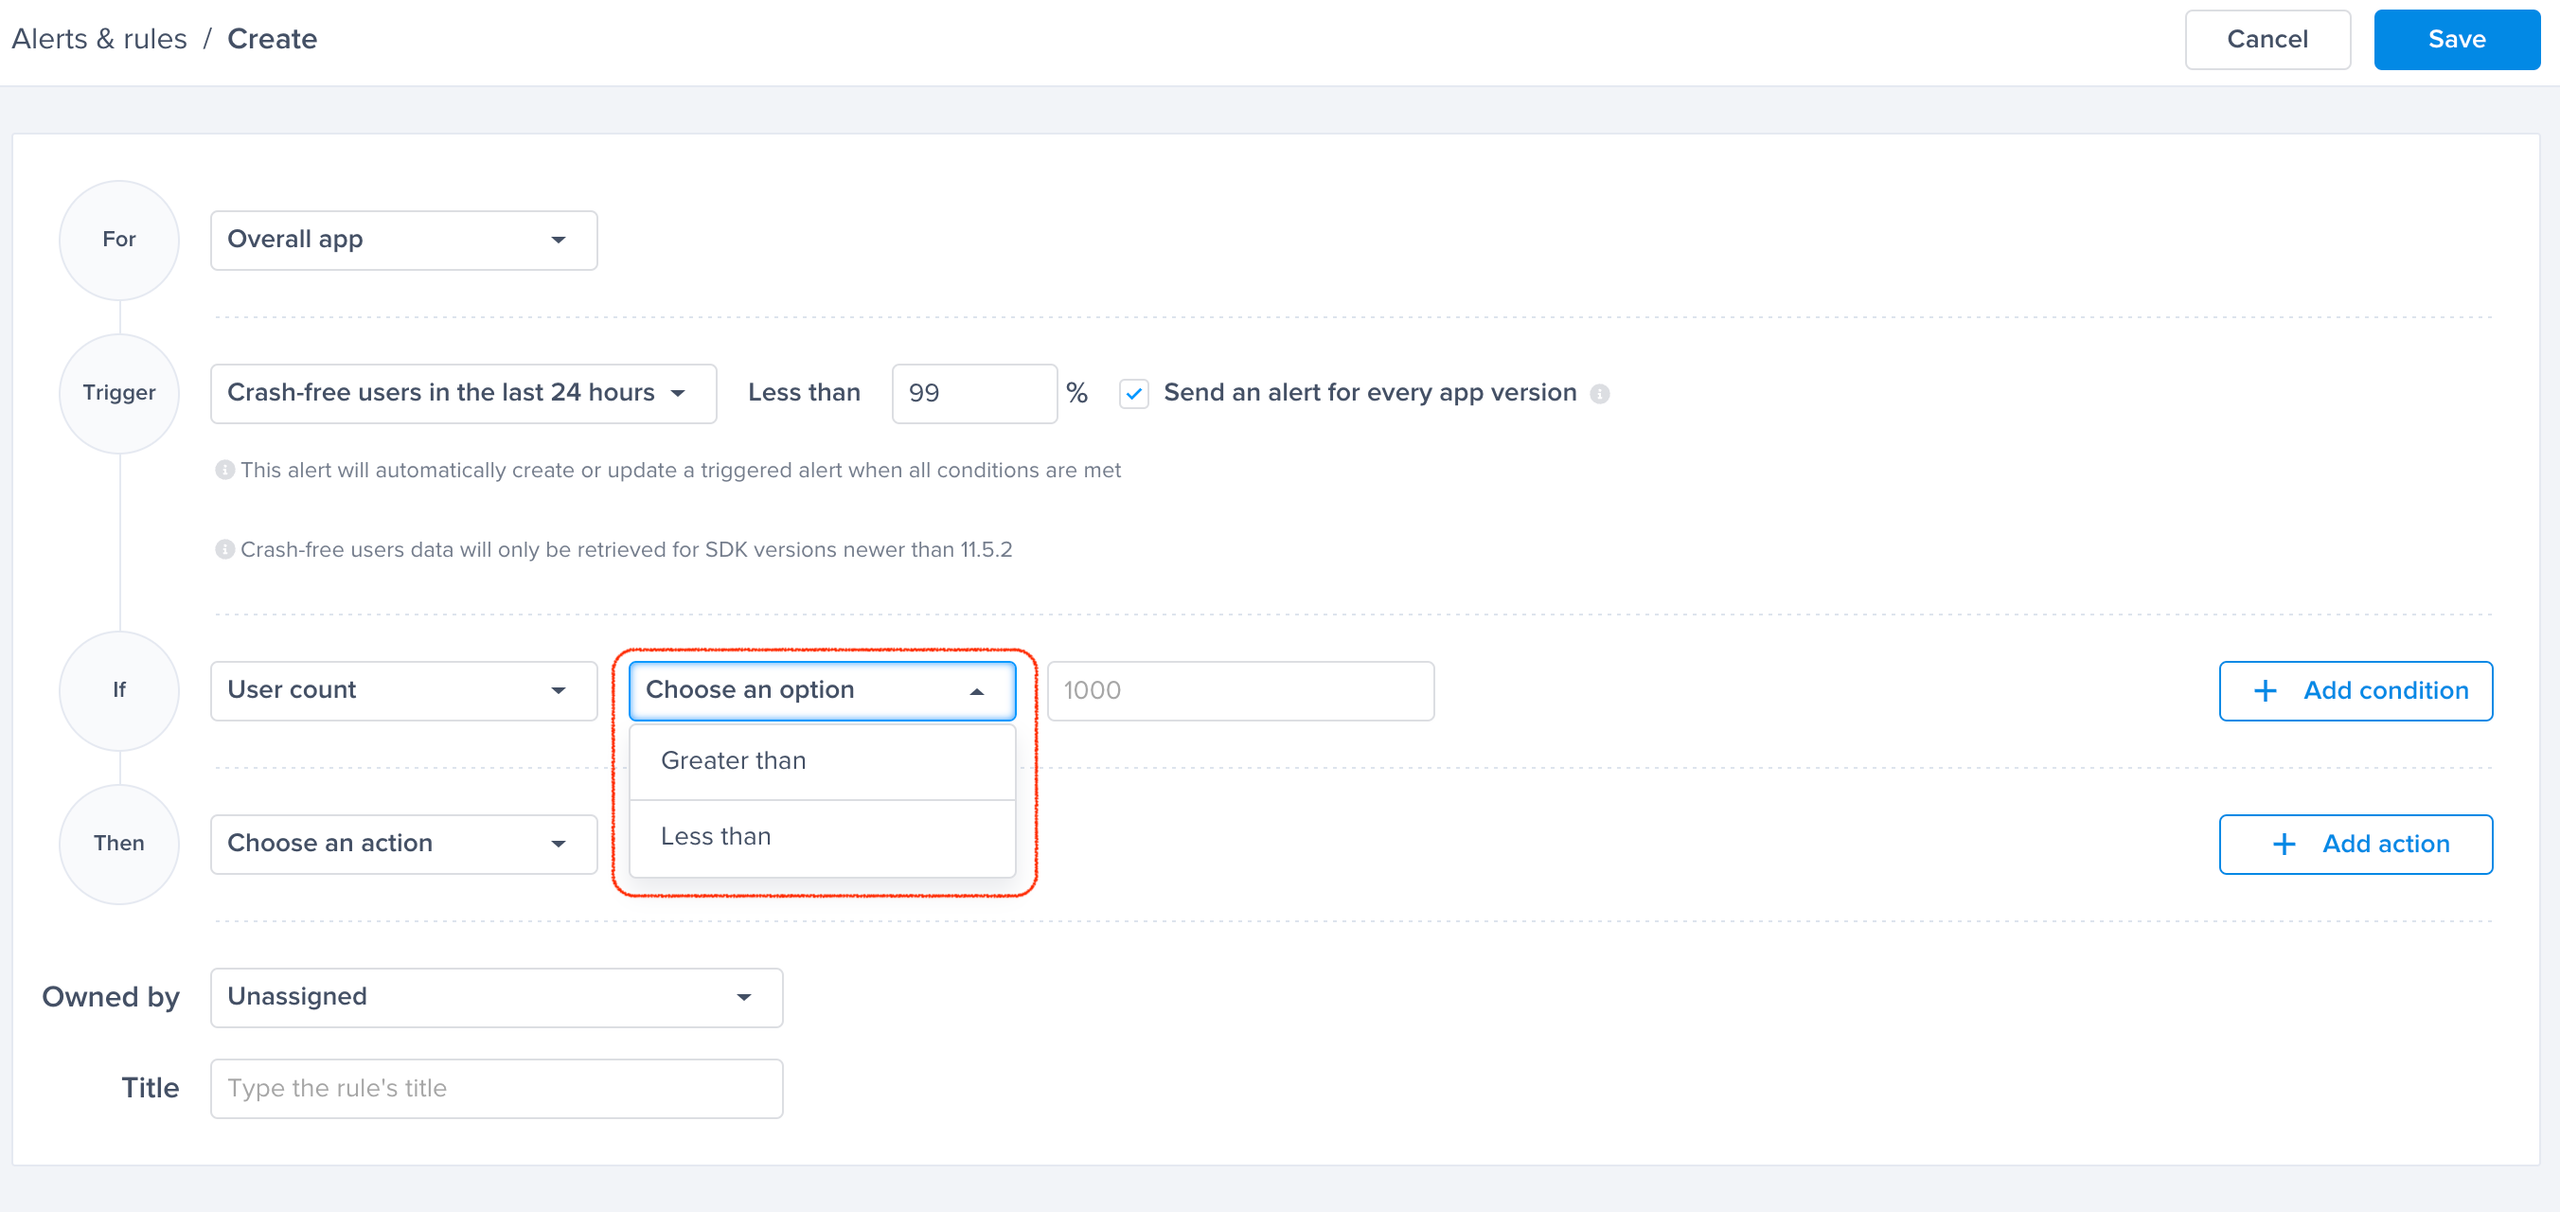
Choose one of the conditions
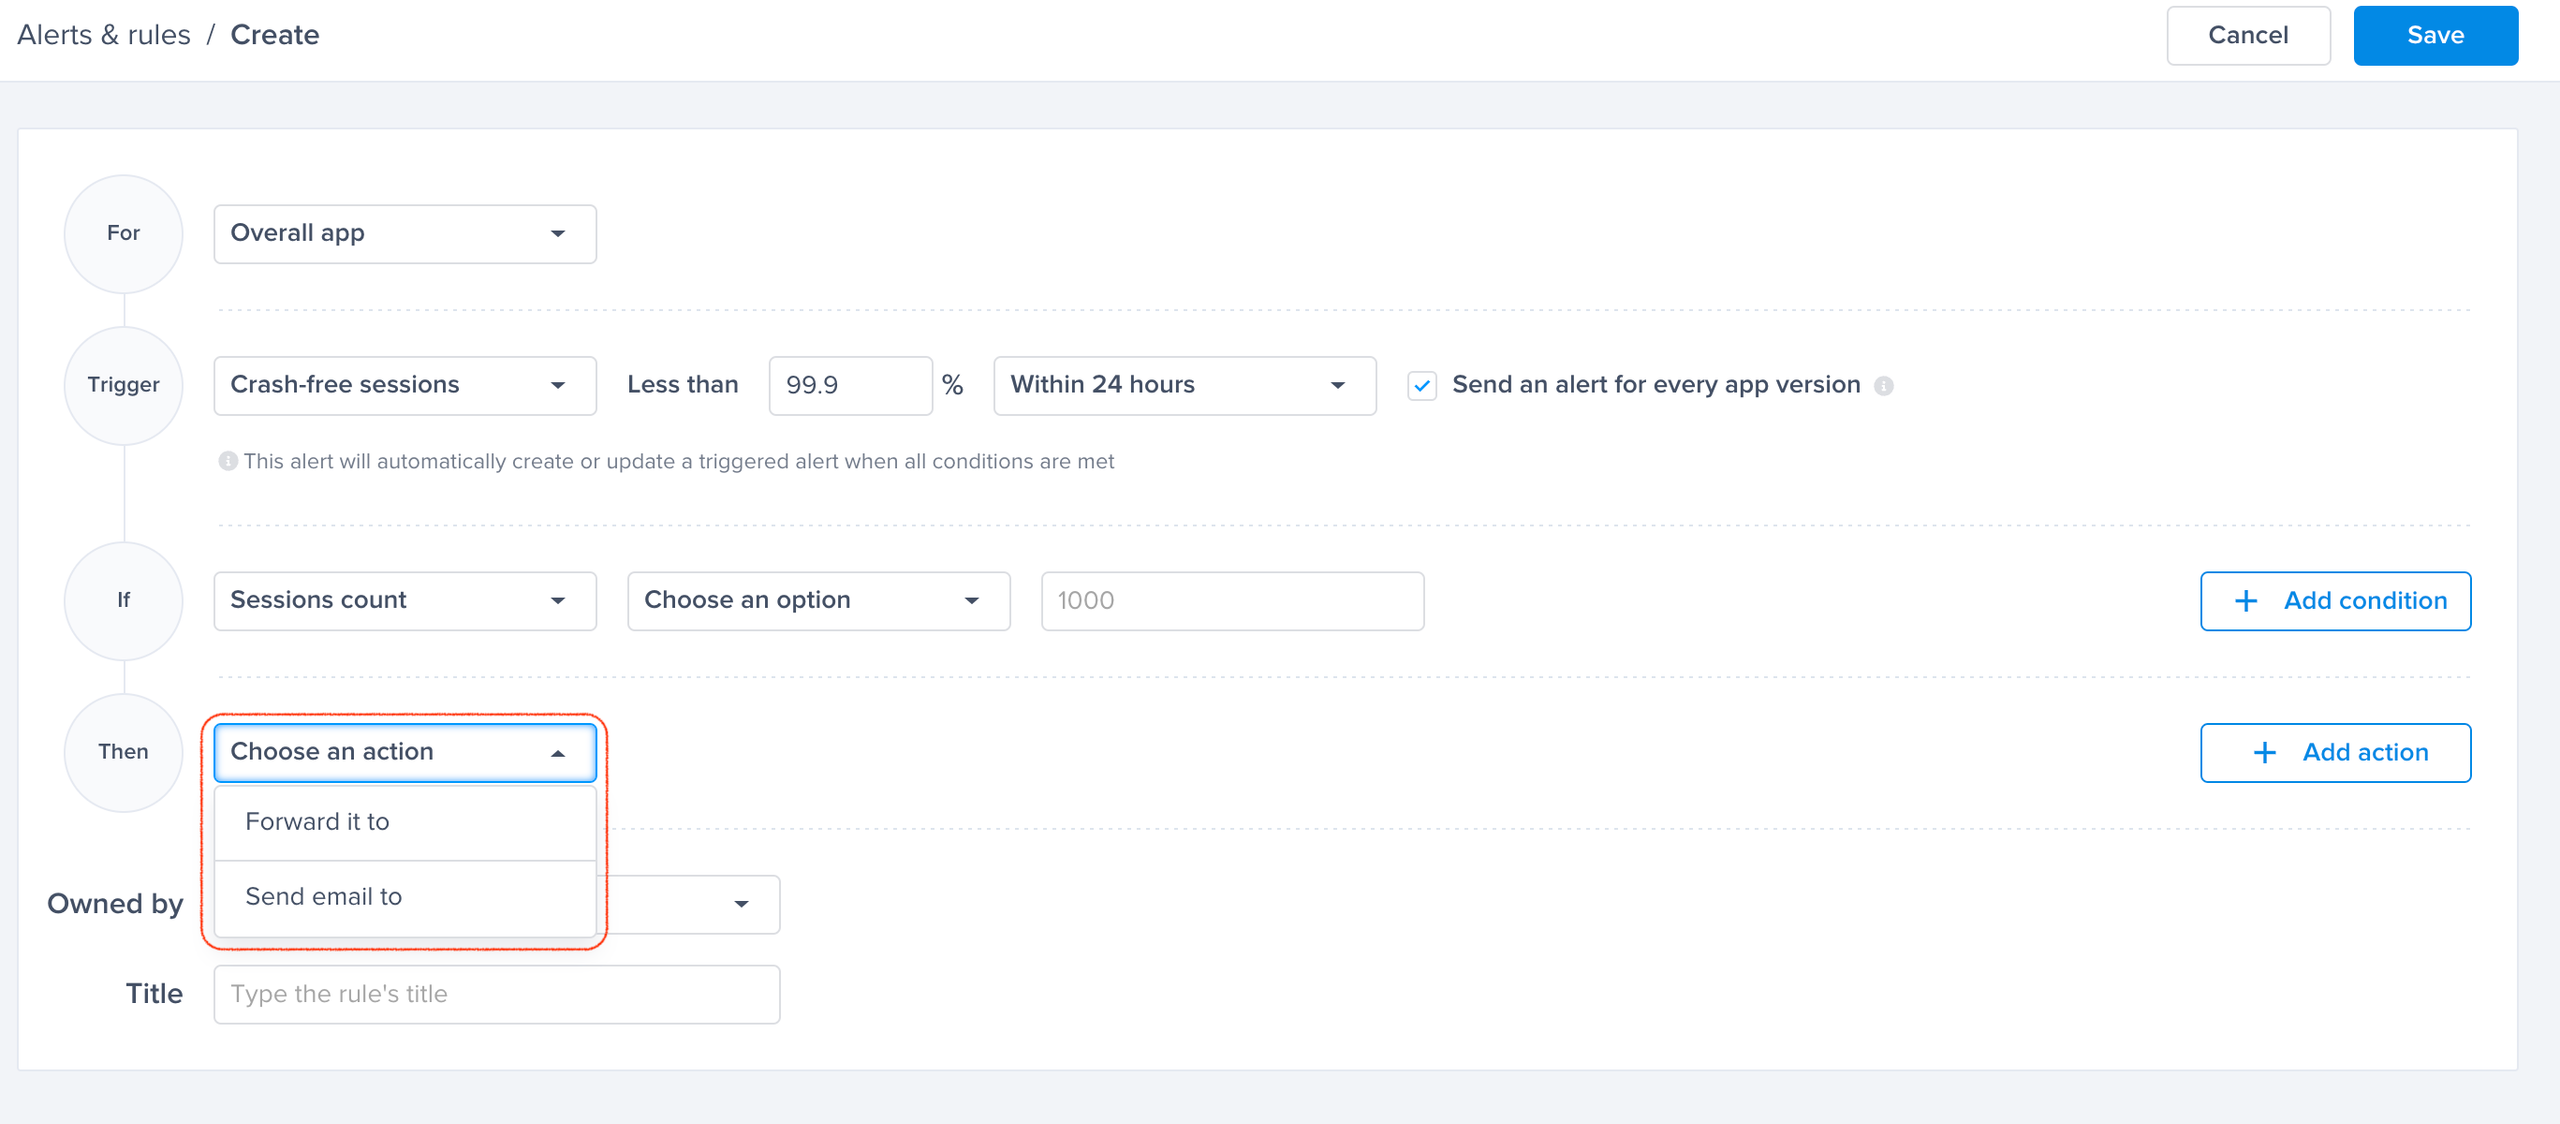
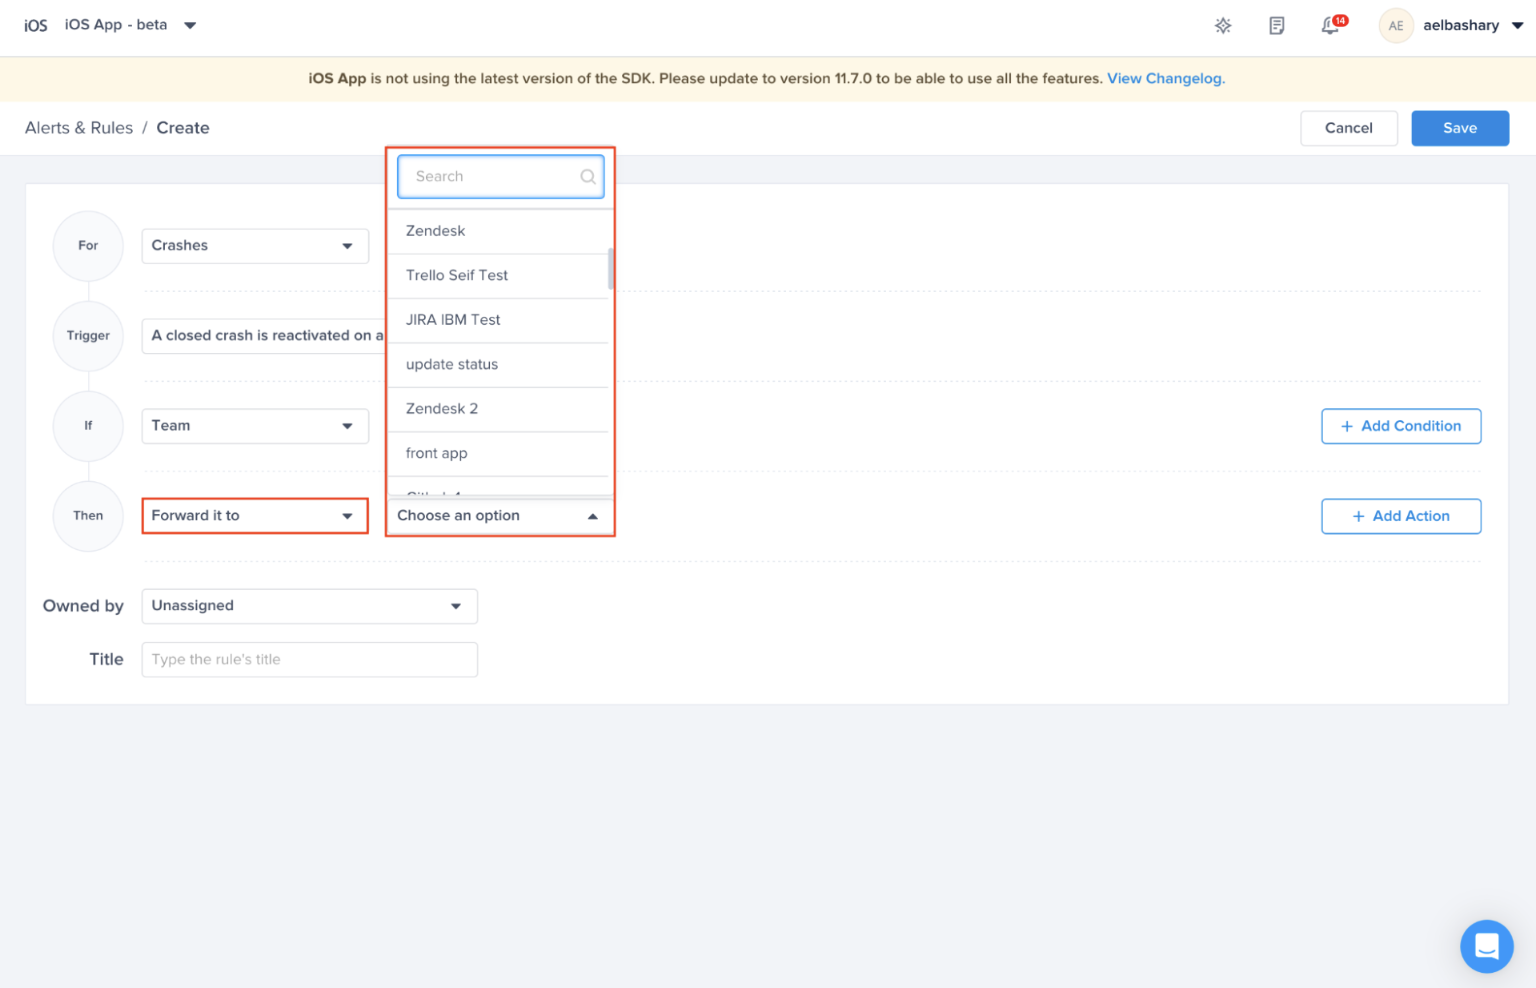
Choose an action to be performed


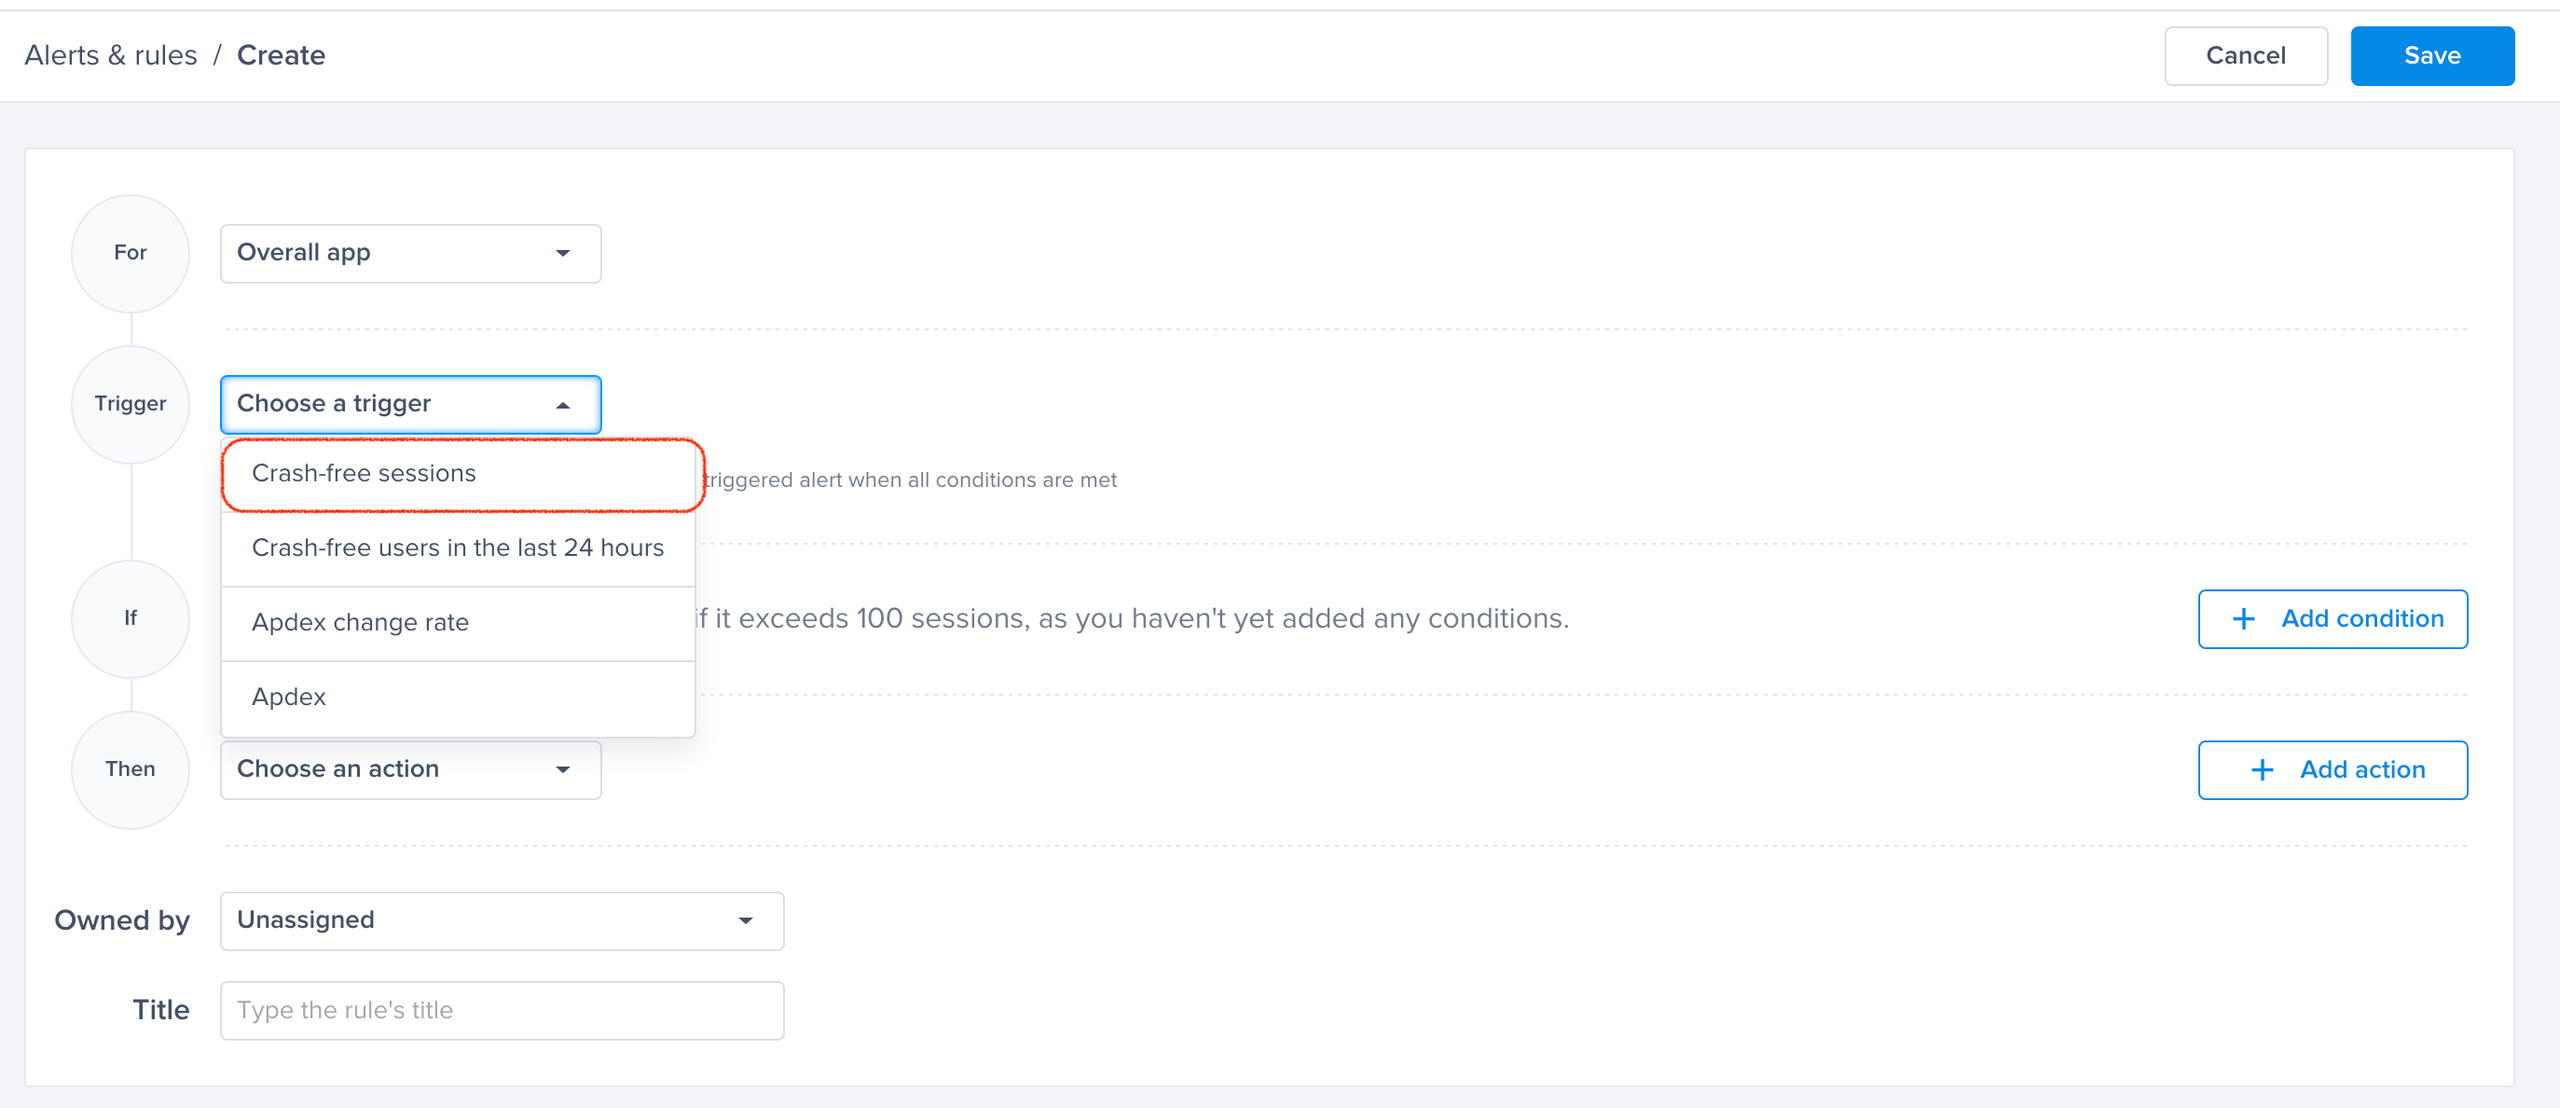
Alerts and rules from the Luciq menu

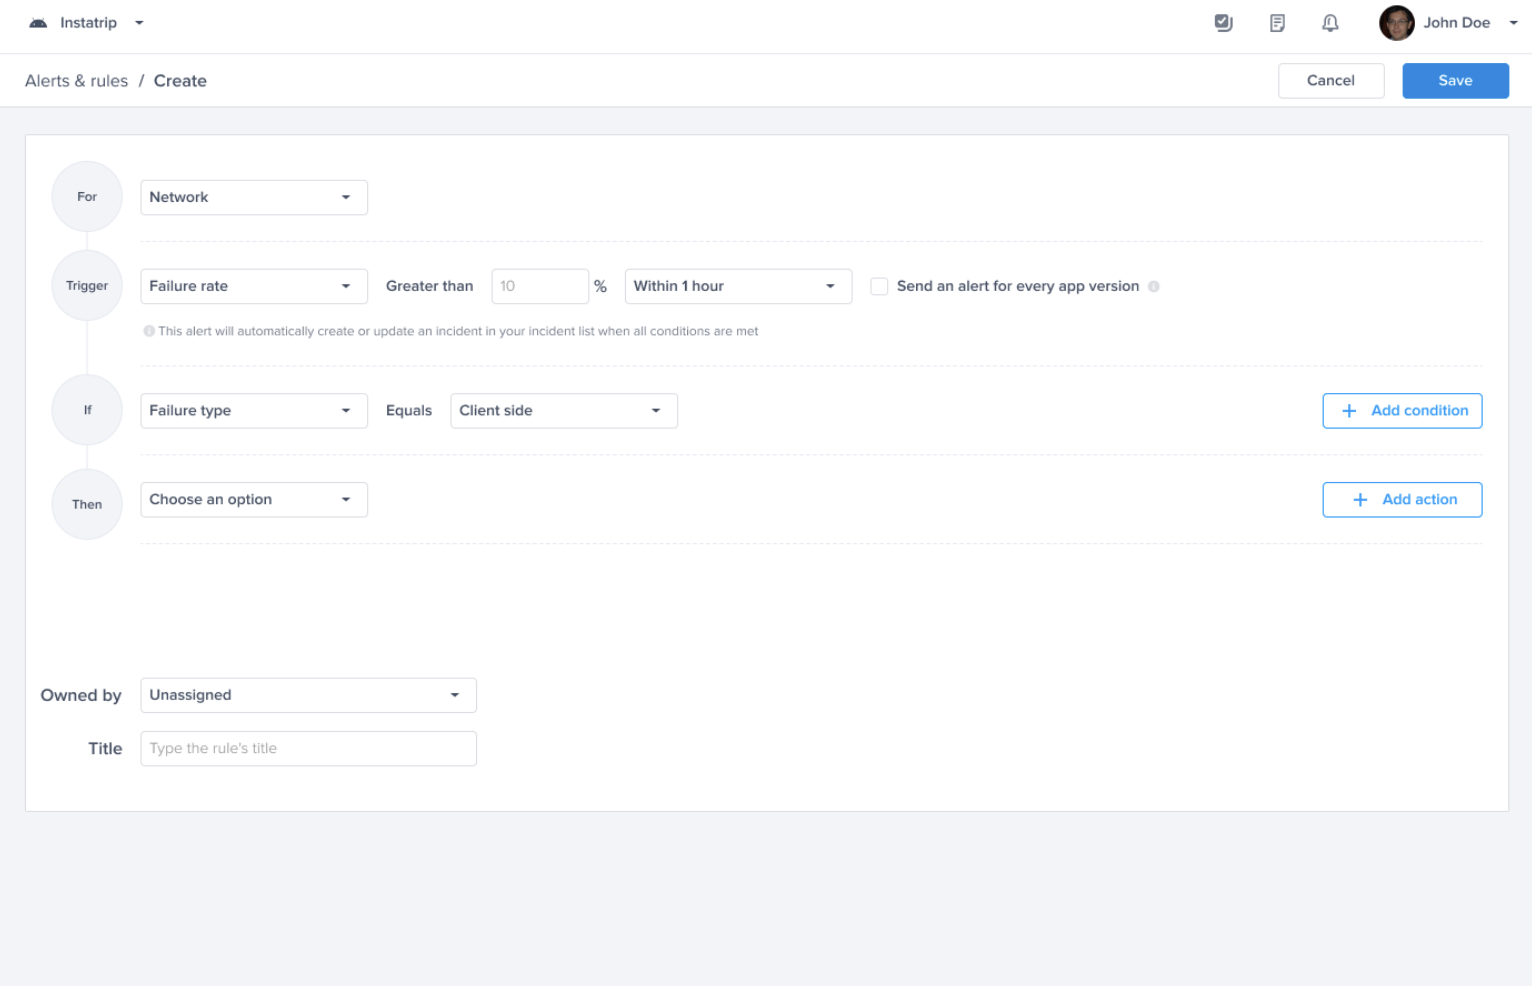
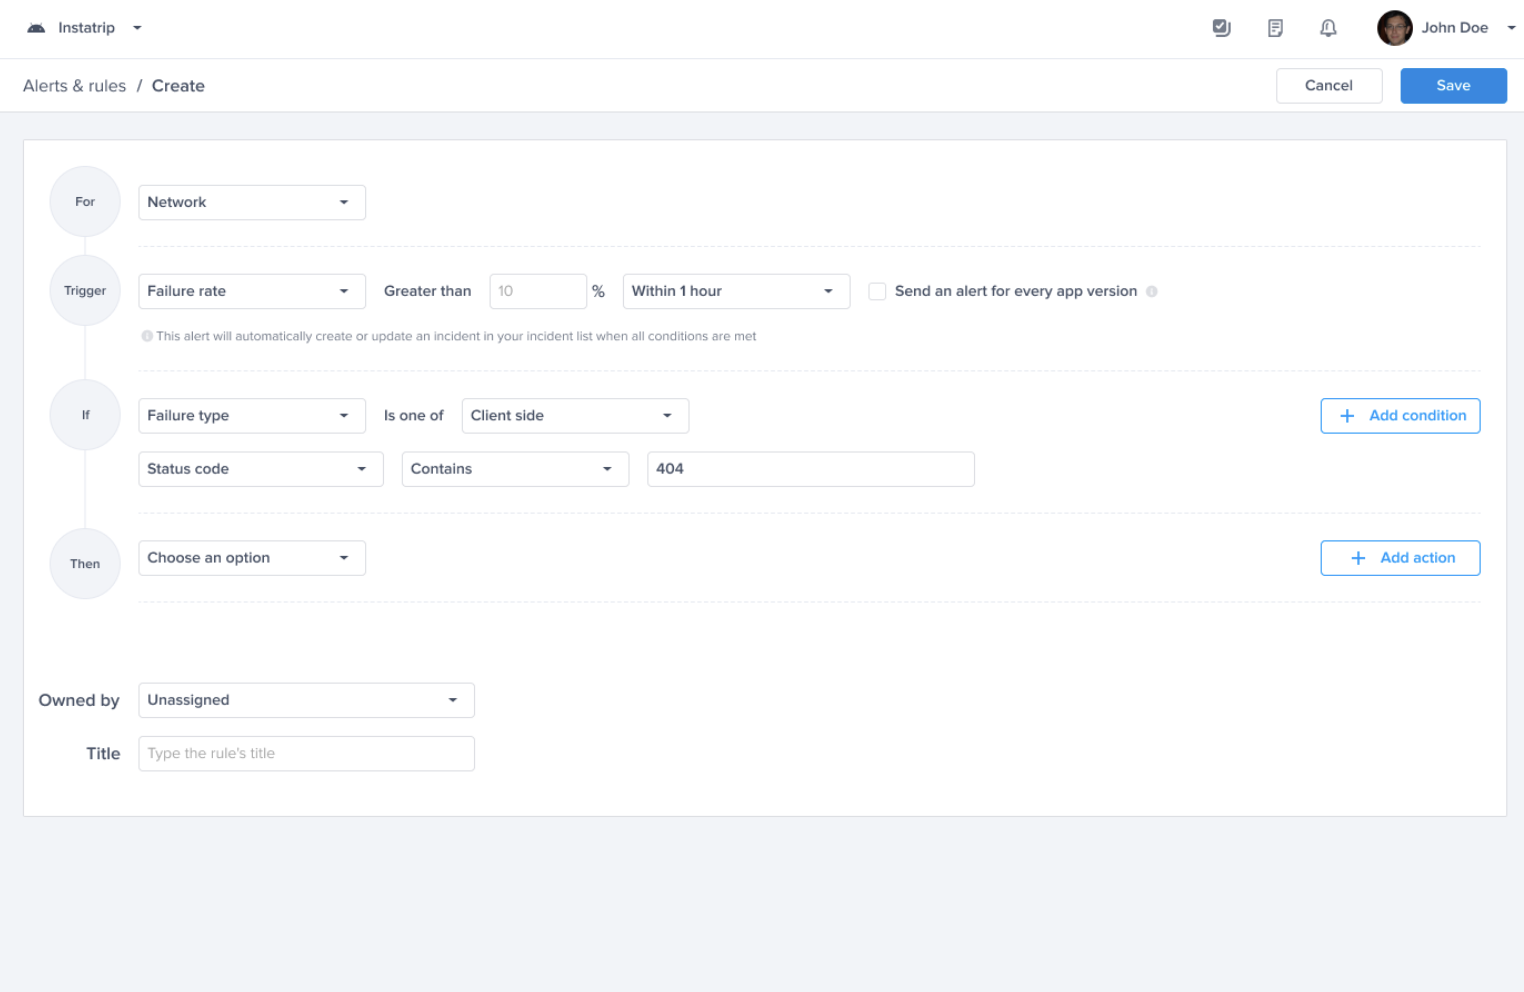
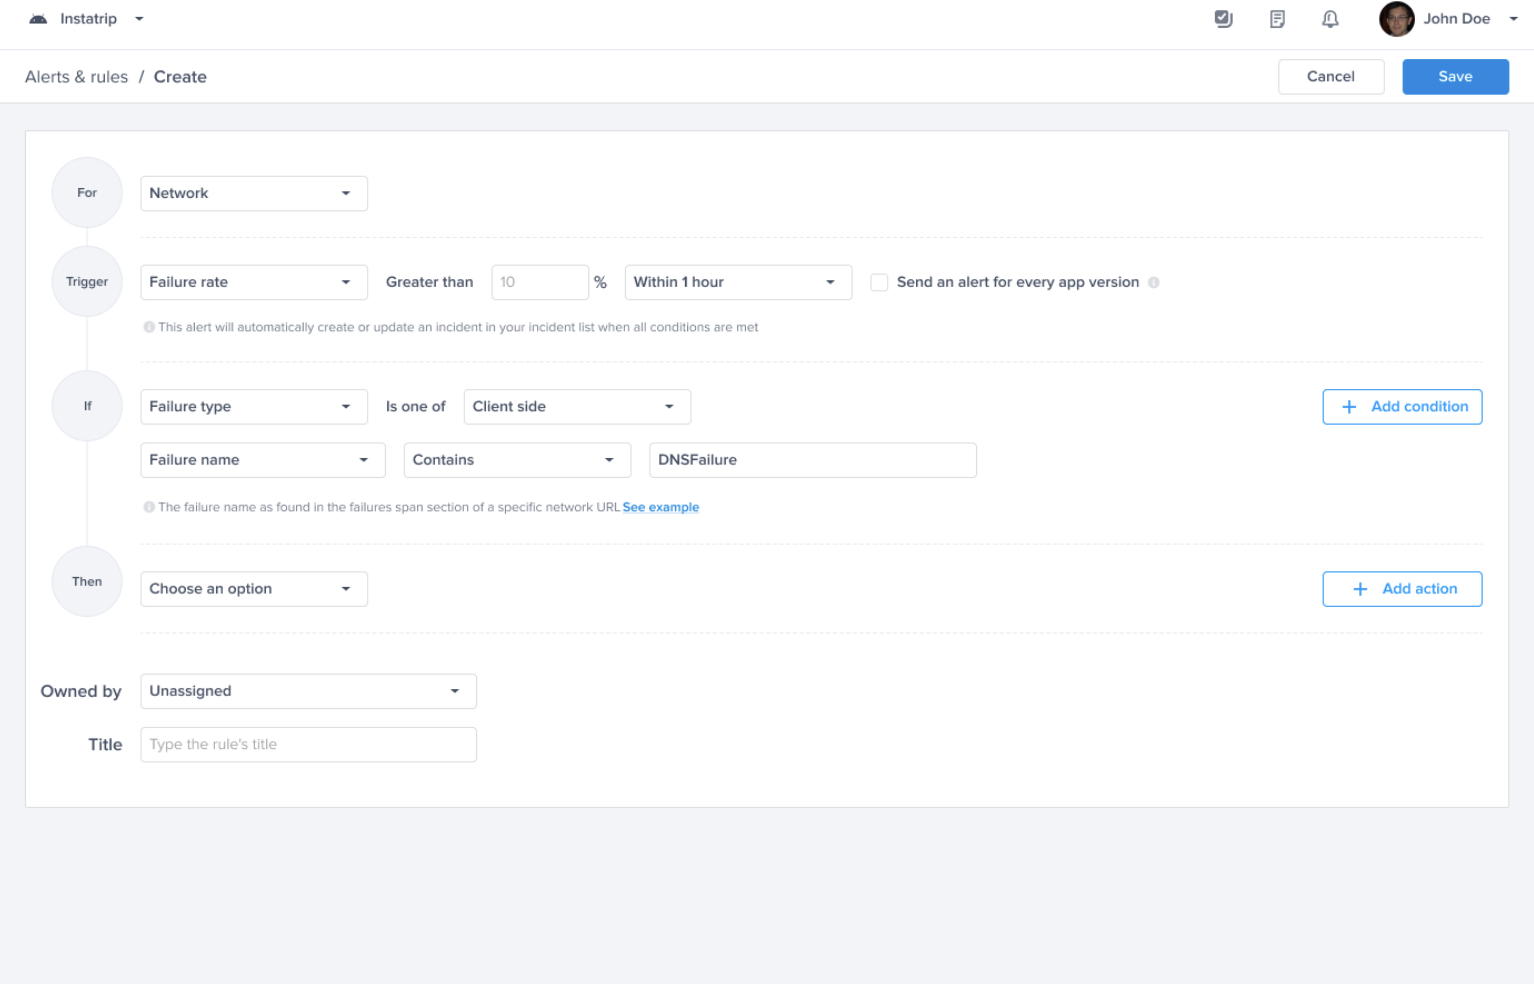
Click on "Create"

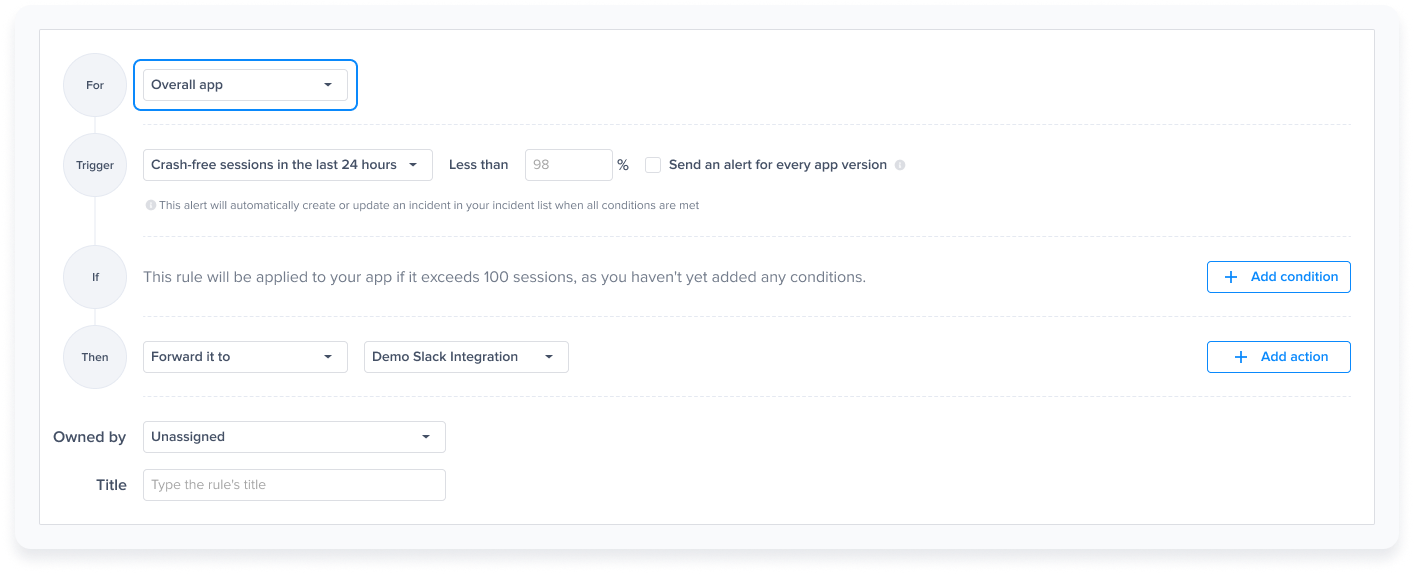
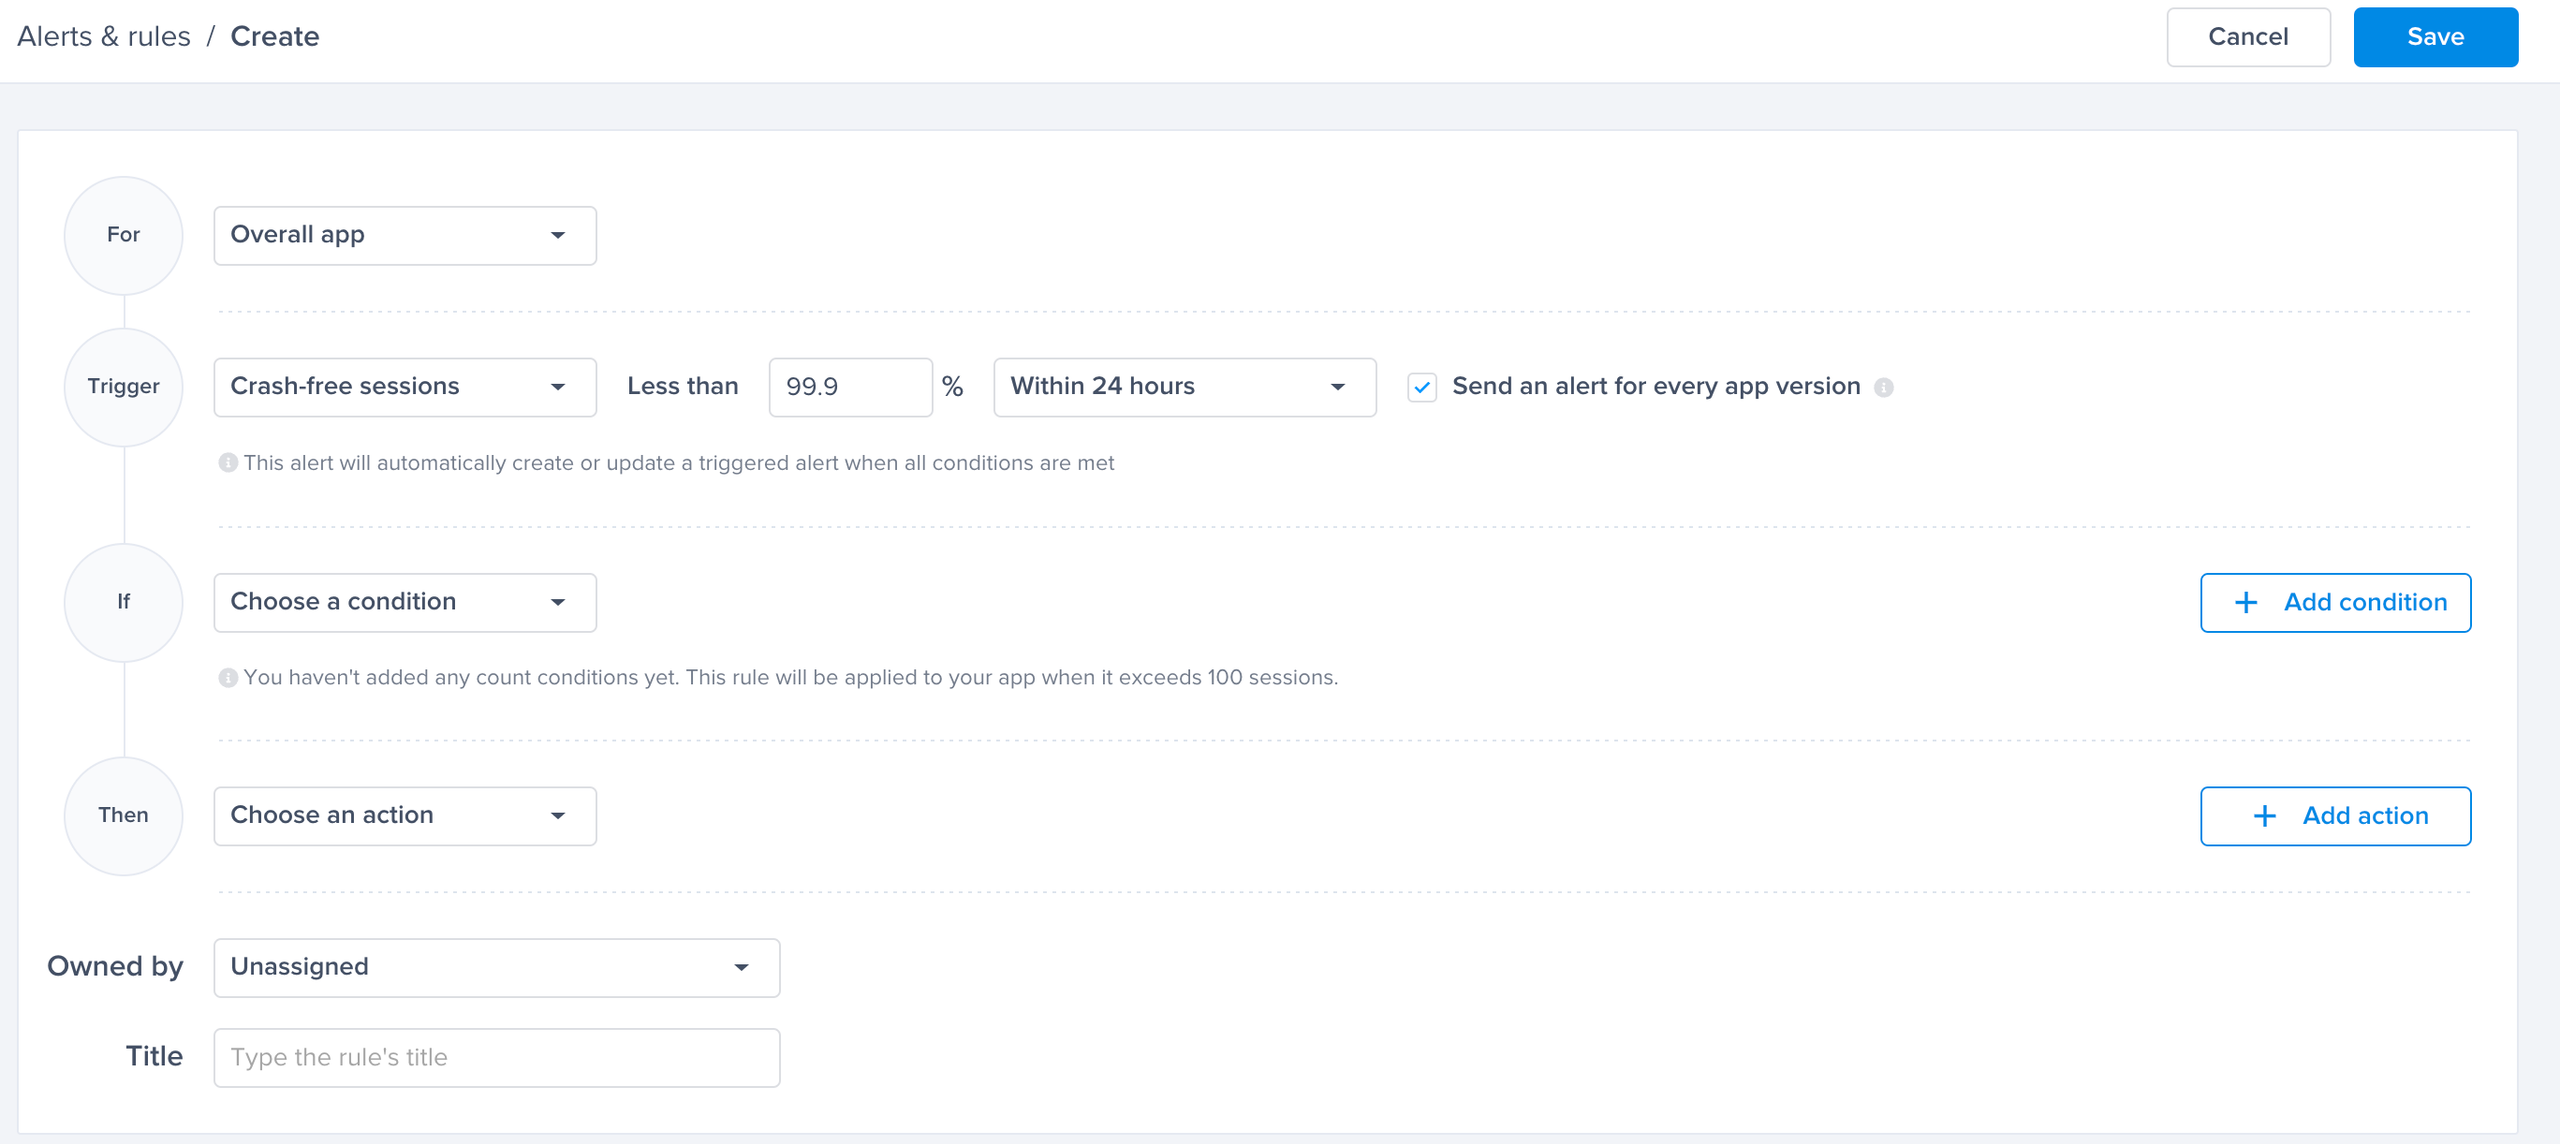
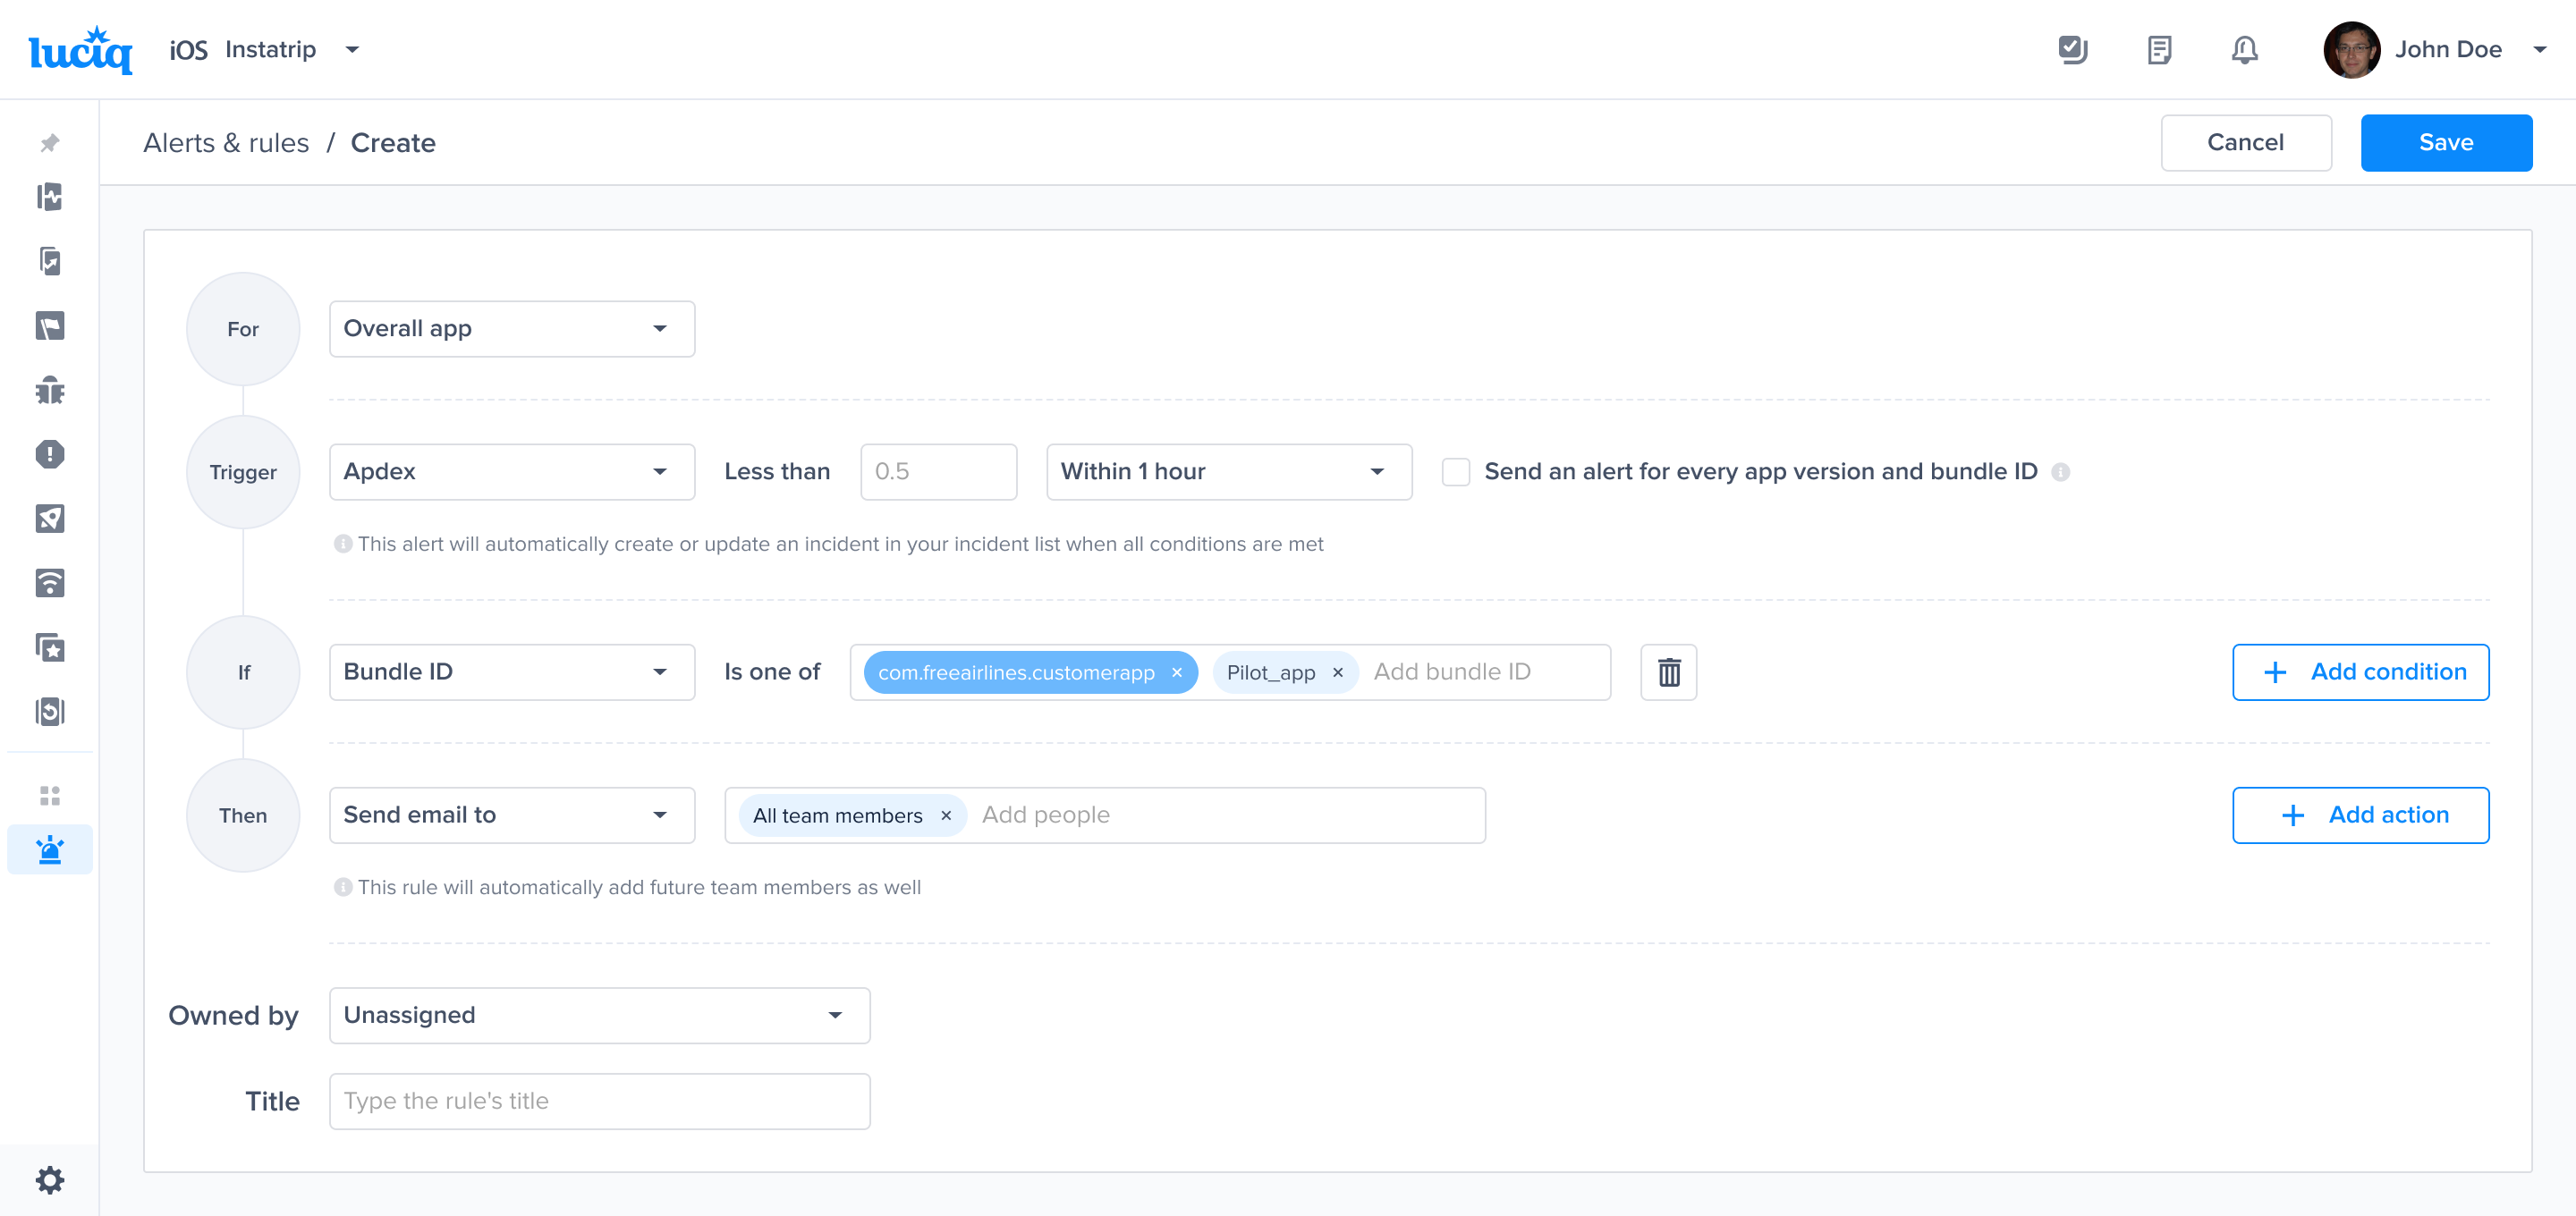
Choose the relevant performance metric for which you want to be alerted
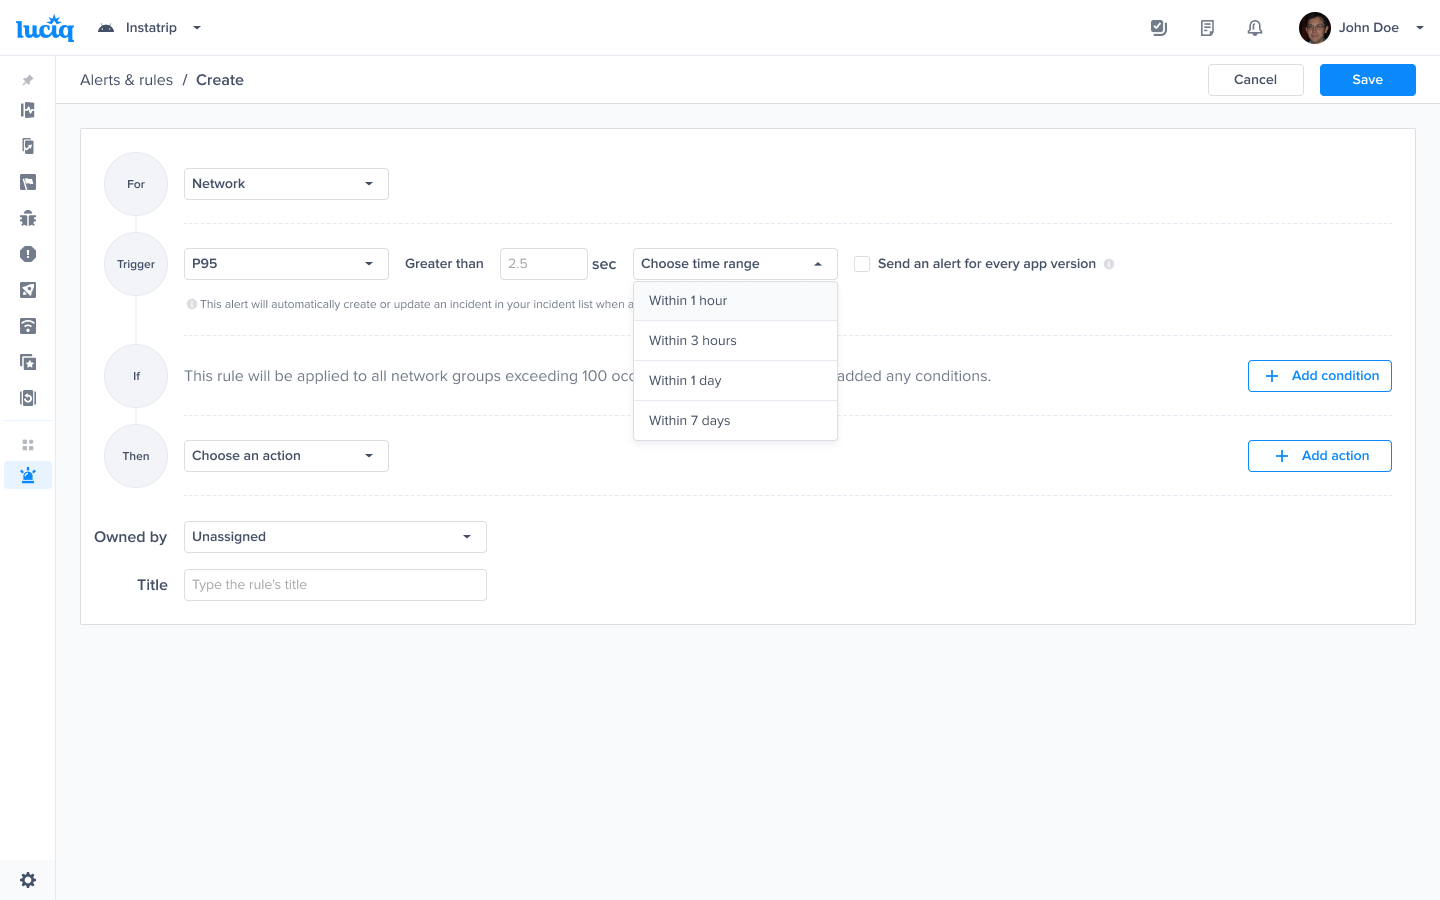
Choose the trigger and time range - Example P95
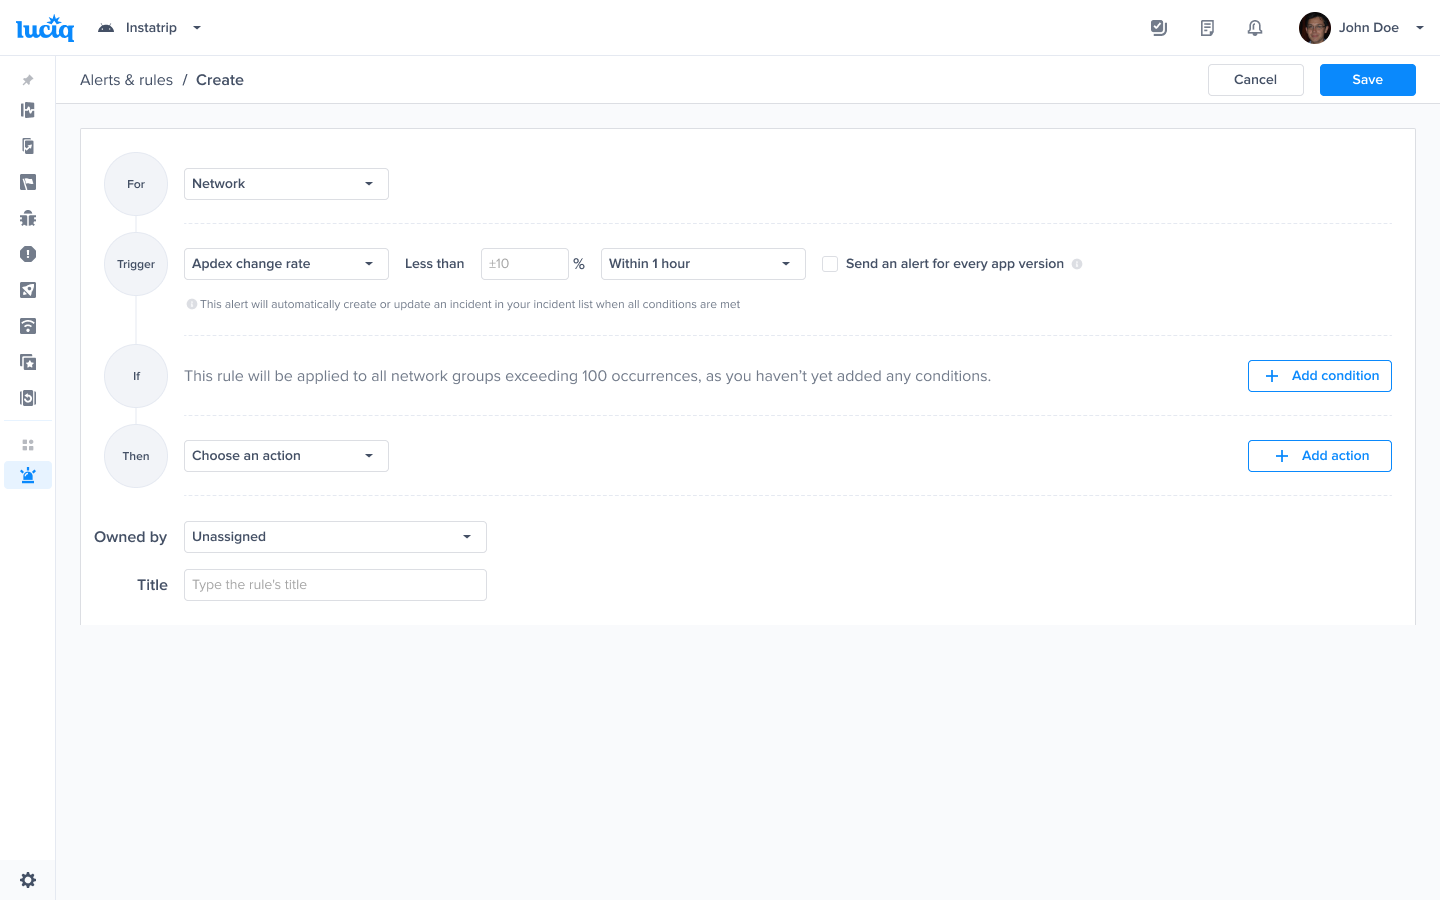
Choose the trigger and time range - Example Apdex change rate and time range
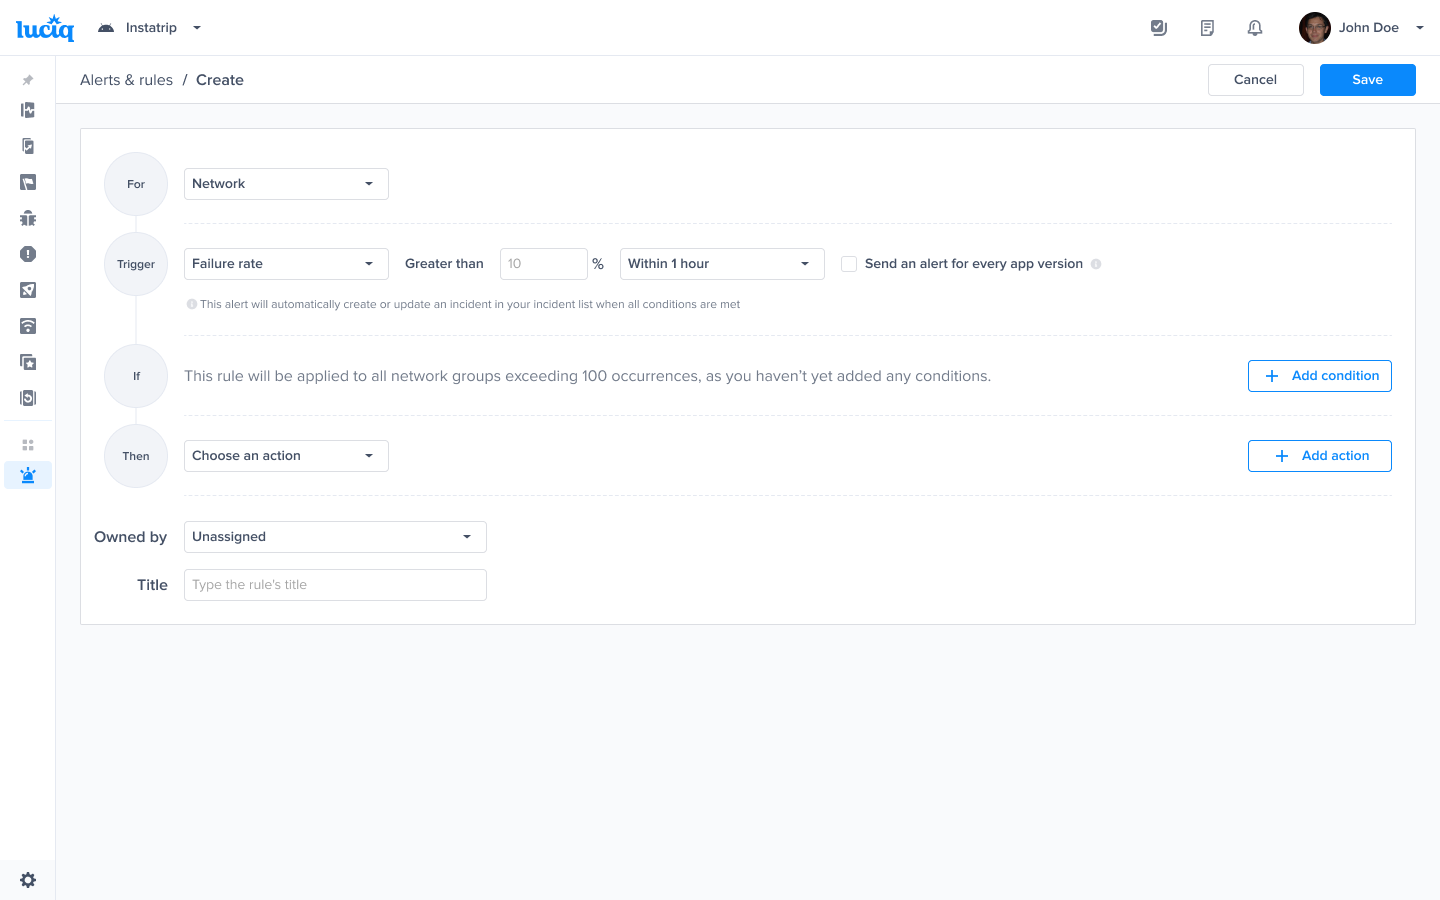
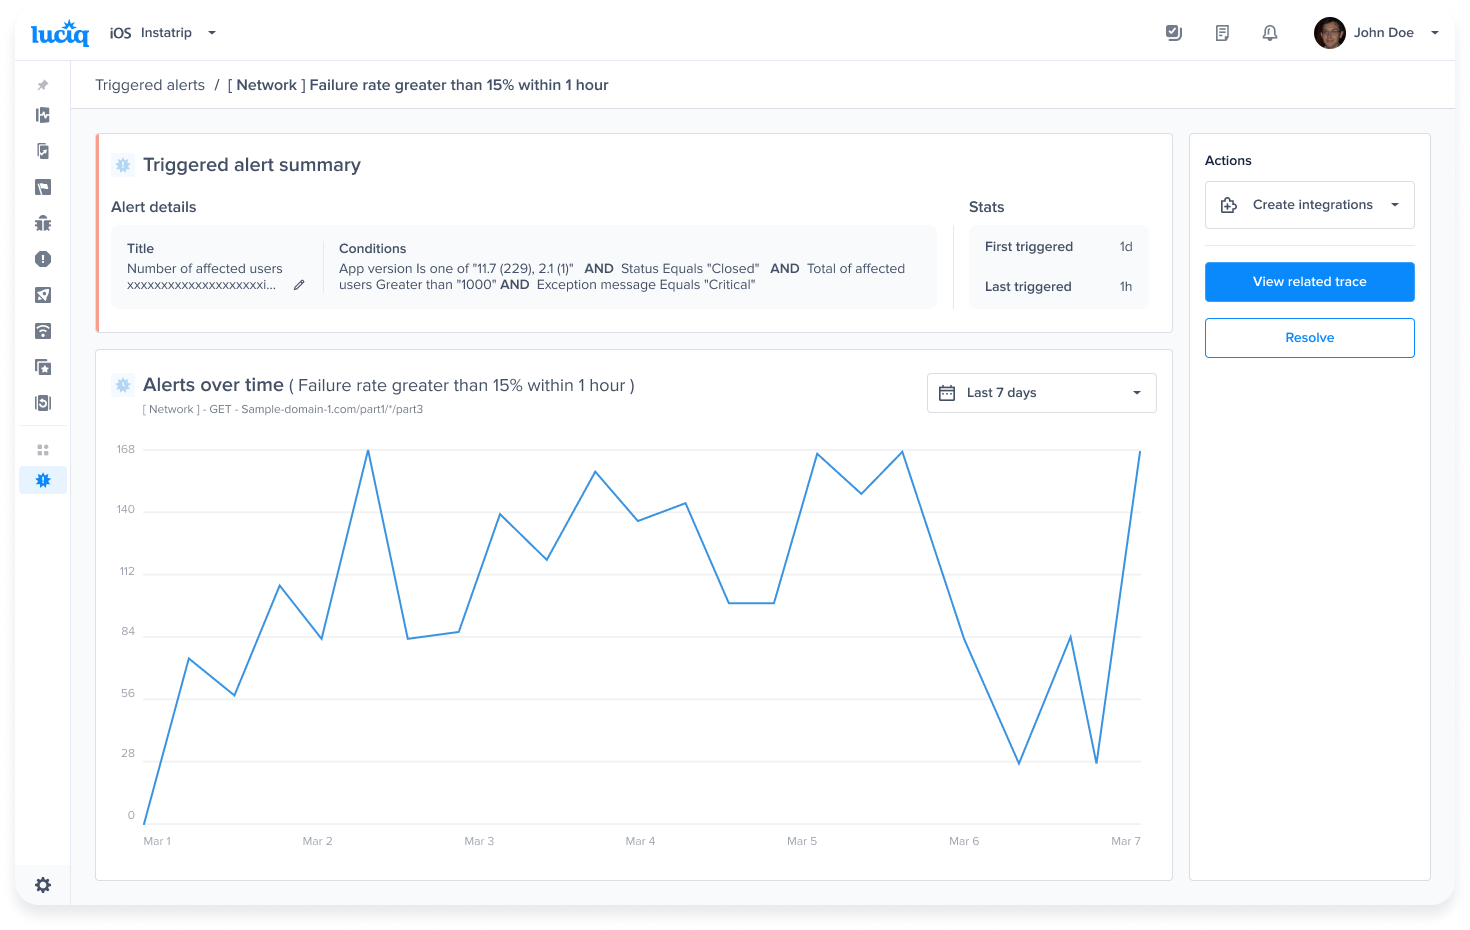
Choose the trigger and time range - Example Failure rate and time range
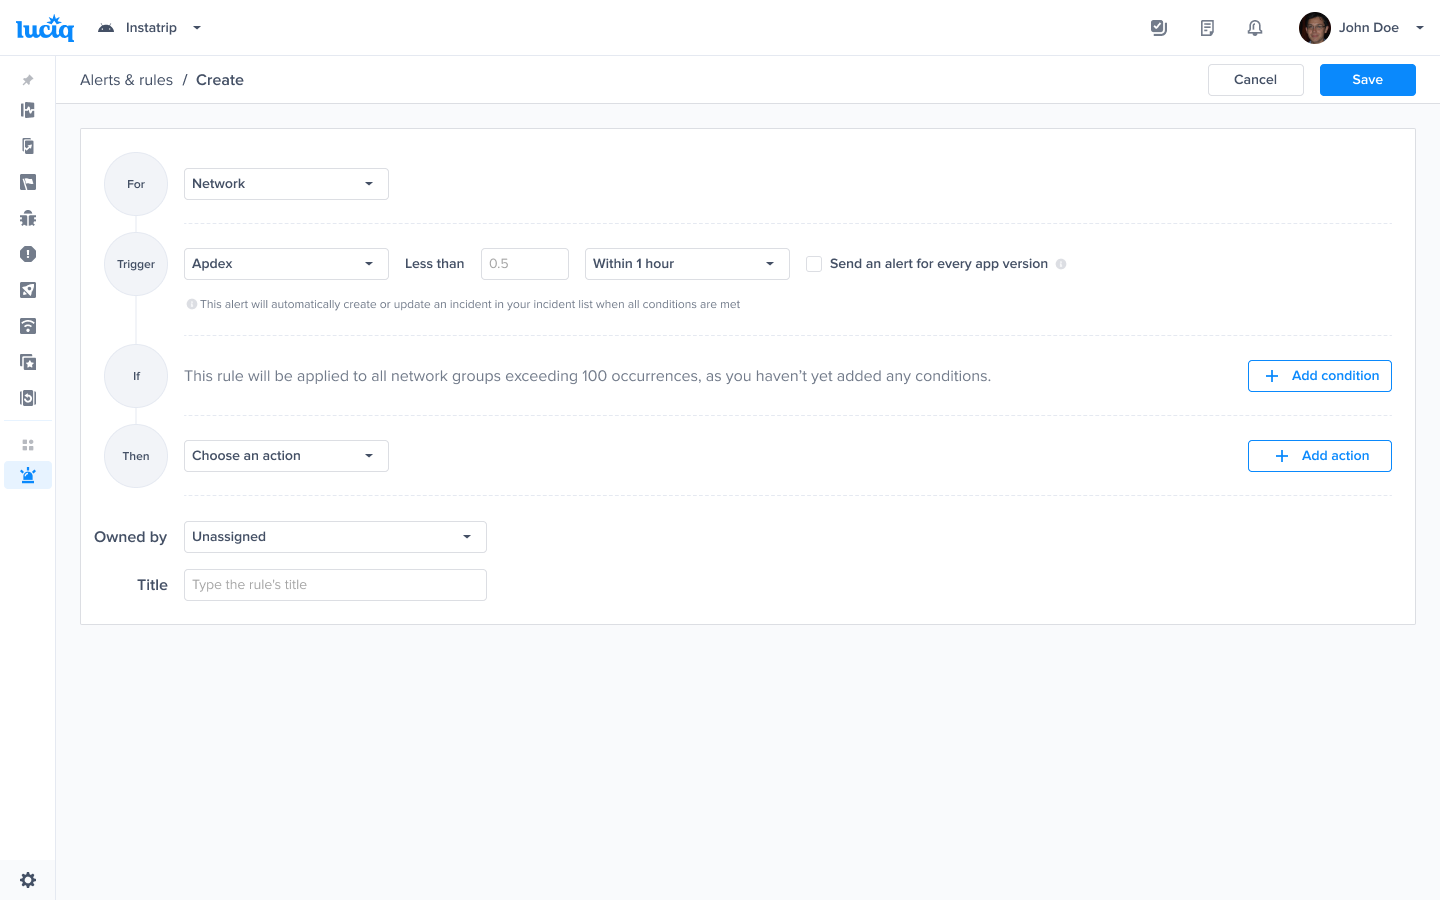
Choose the trigger and time range - Example Apdex and time range
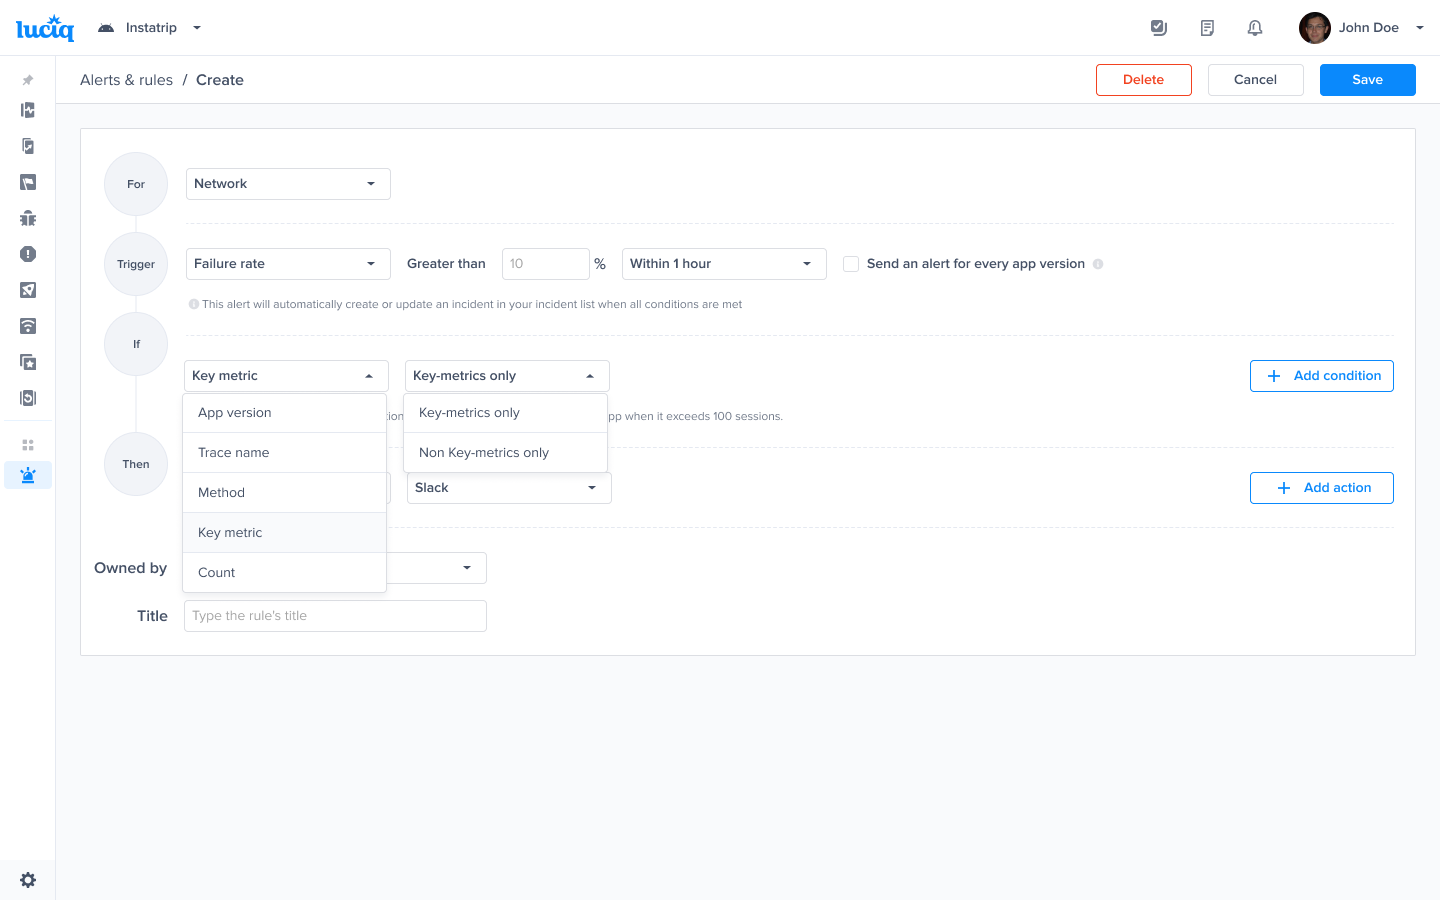
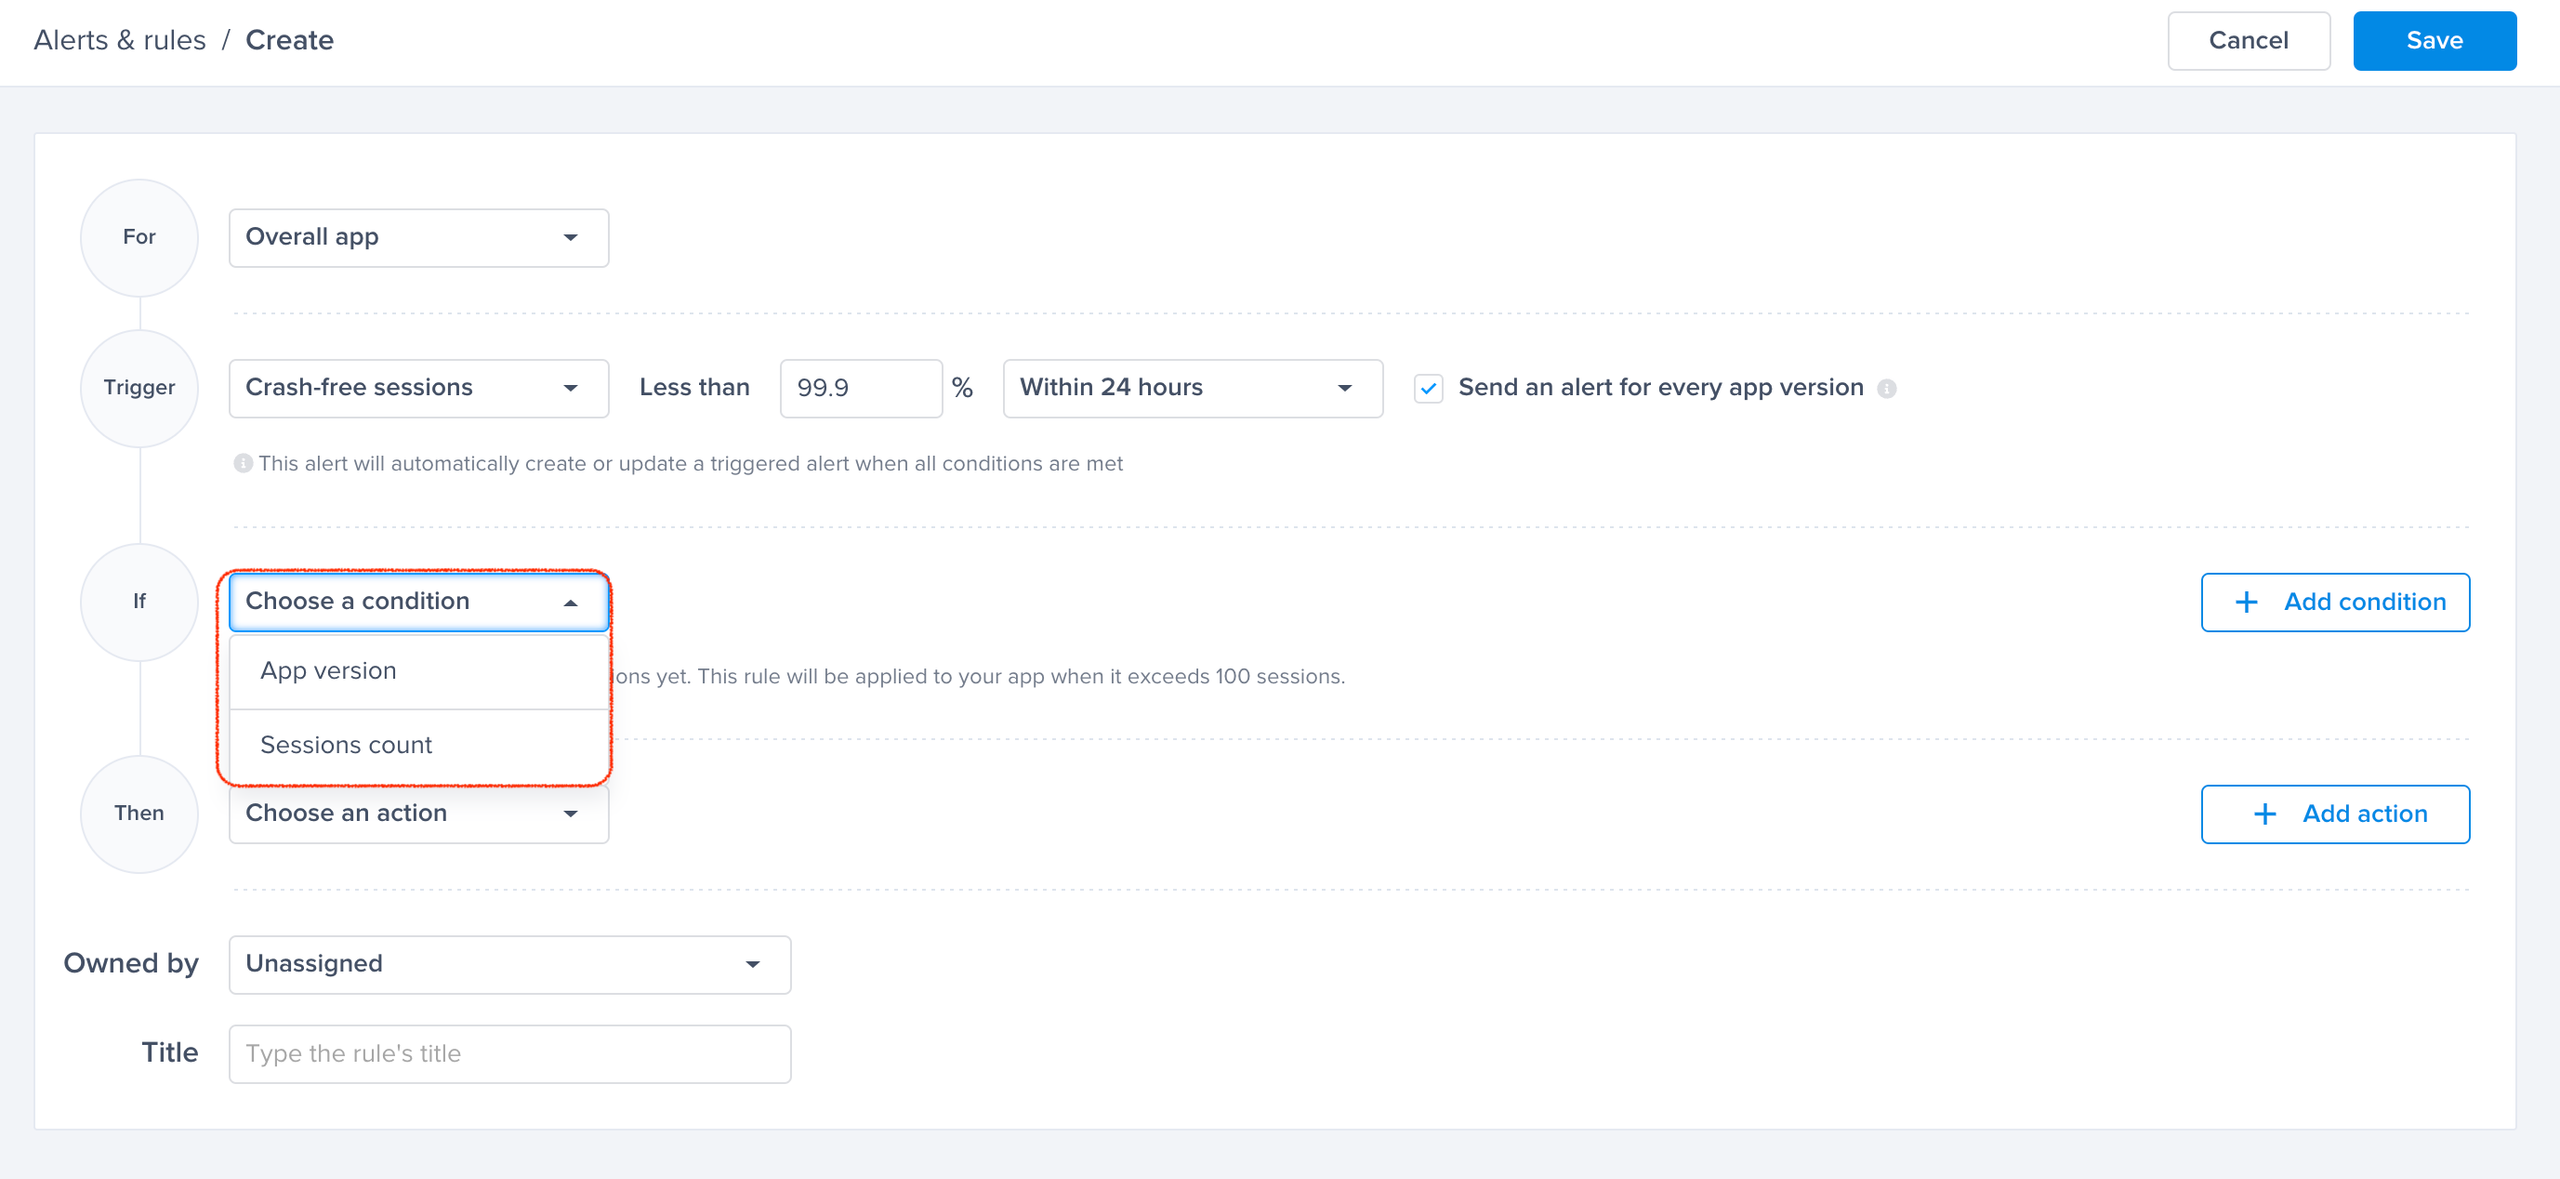
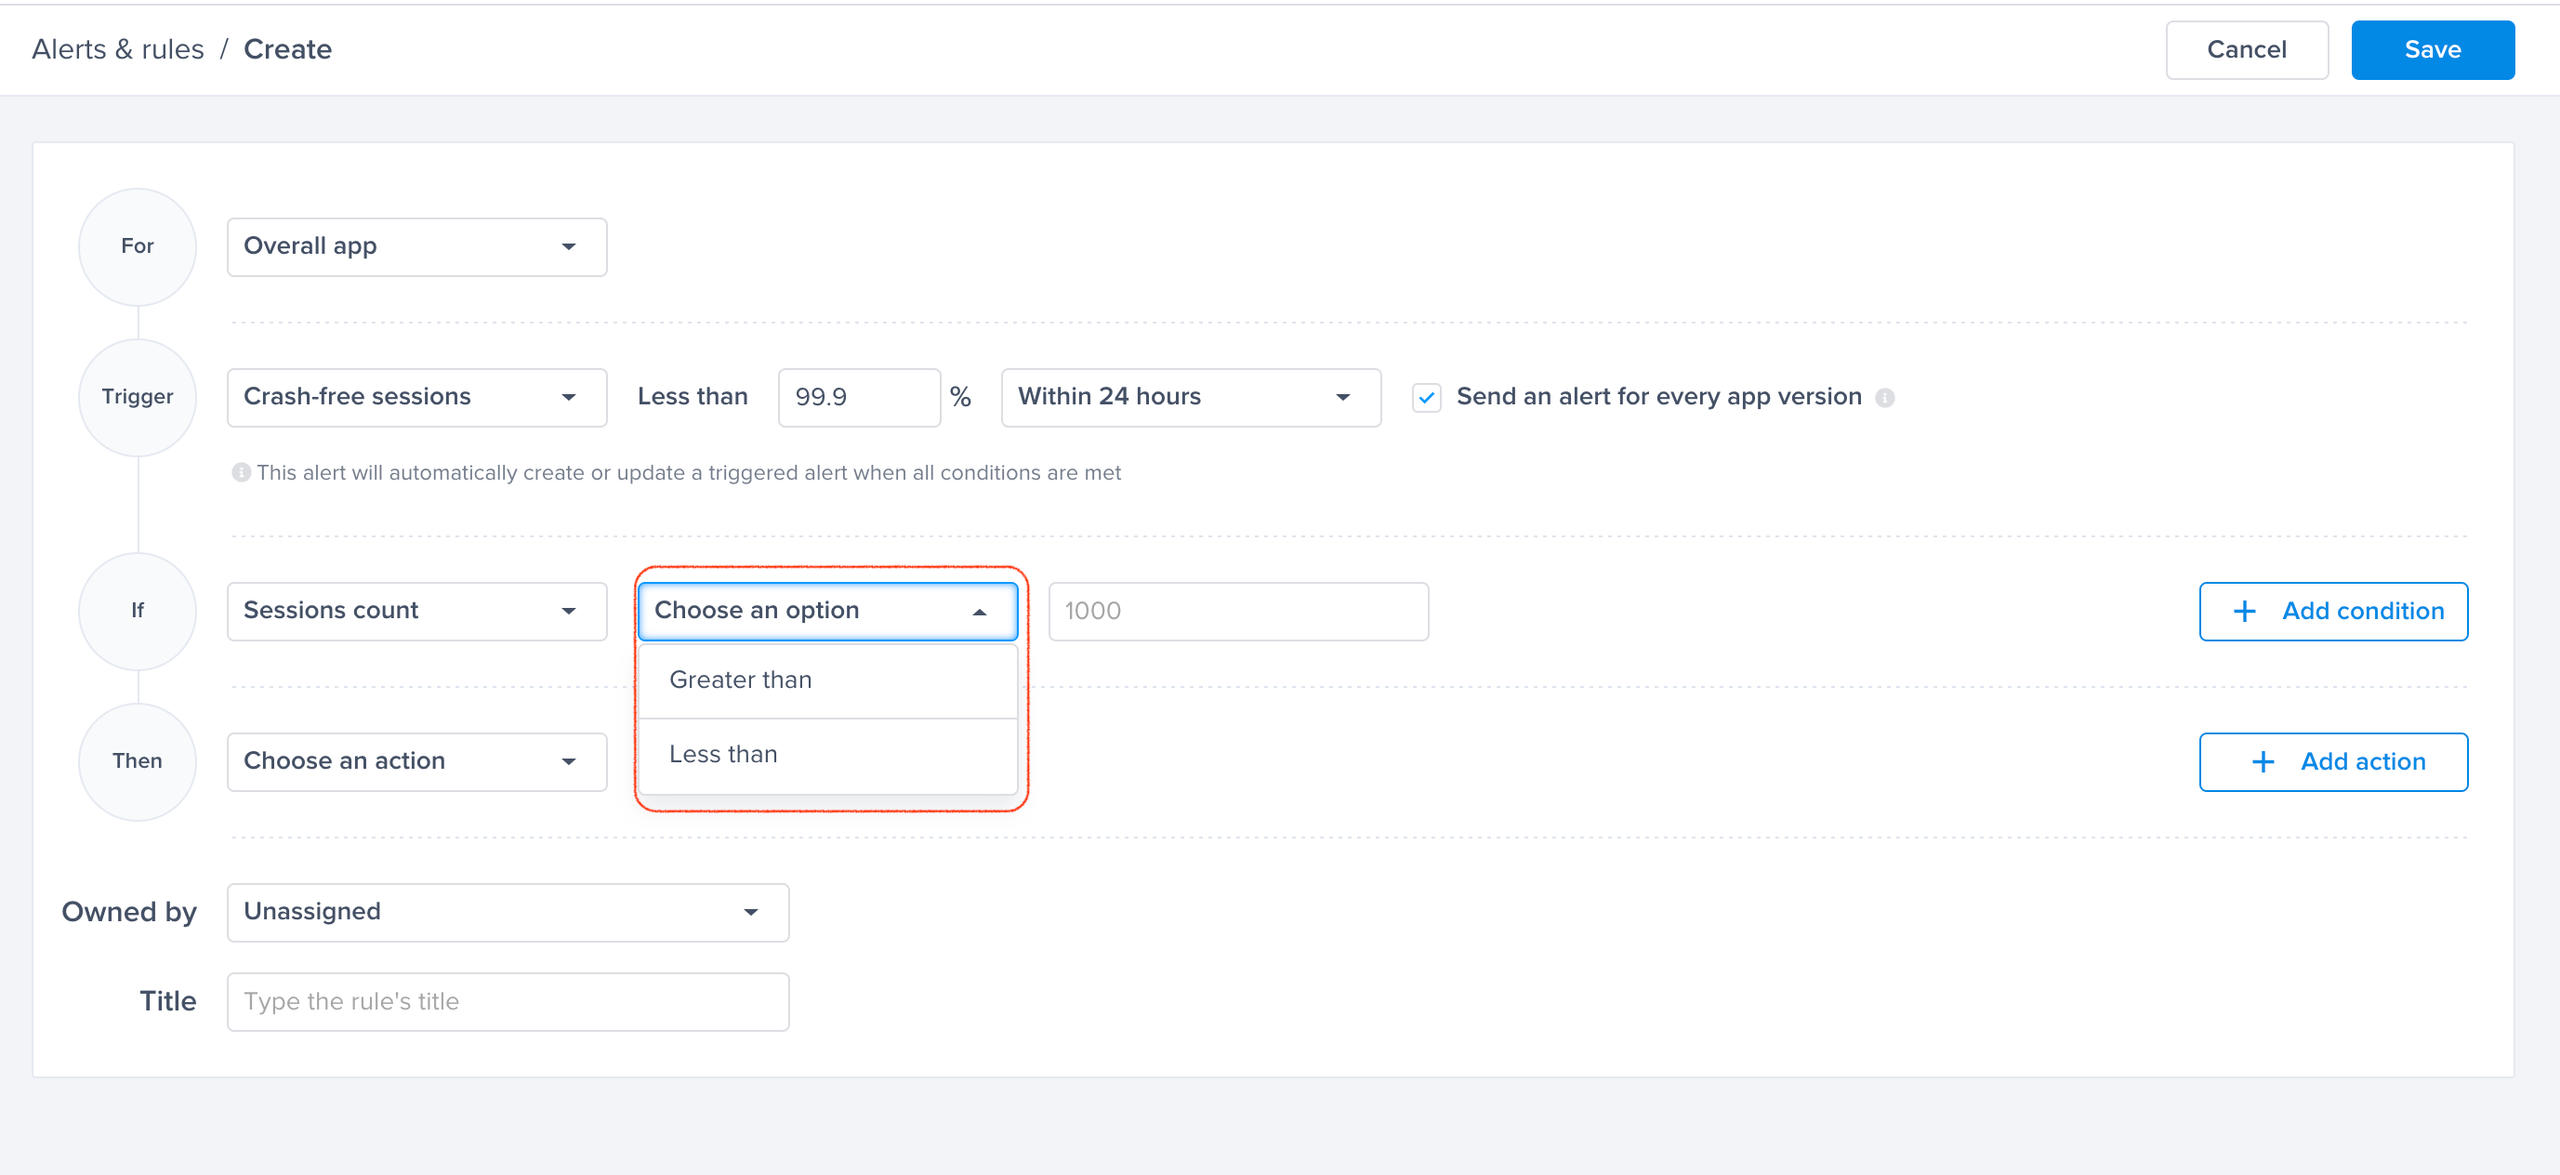
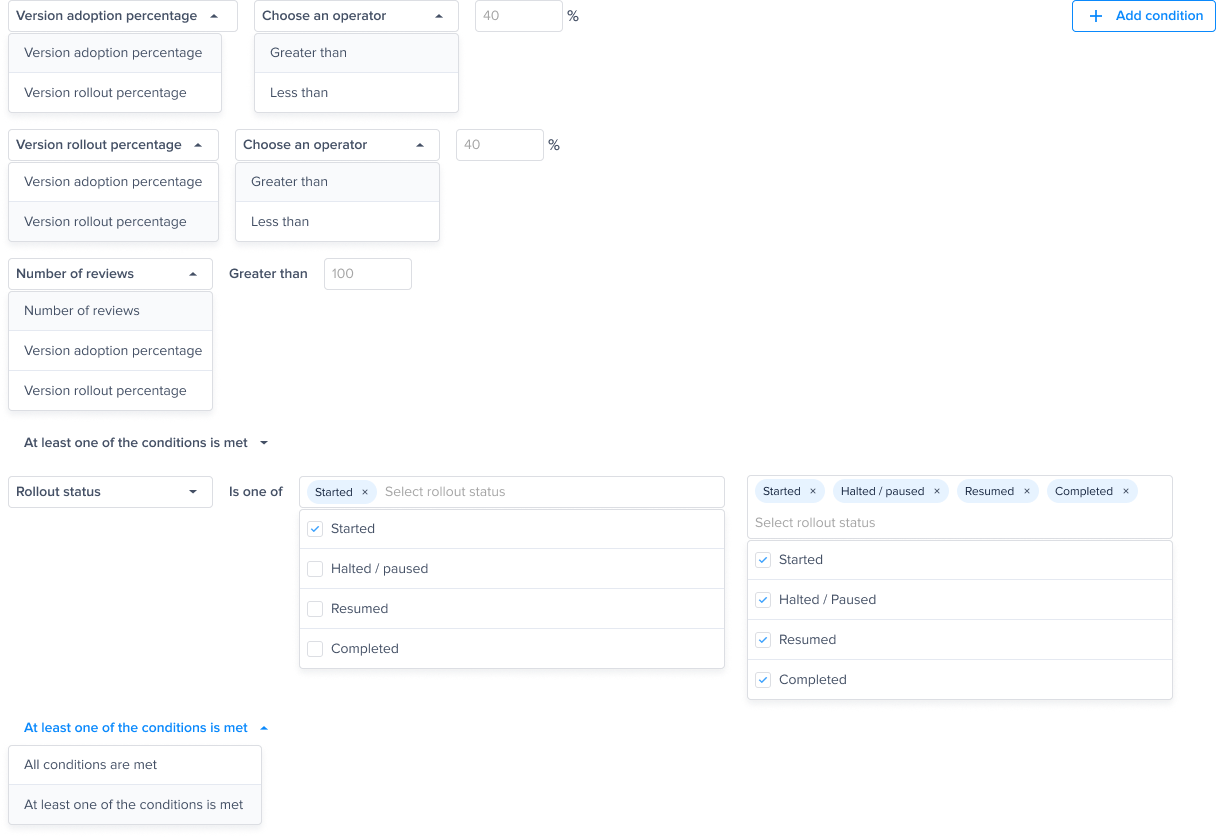
Choose the condition that should be checked to get alerted
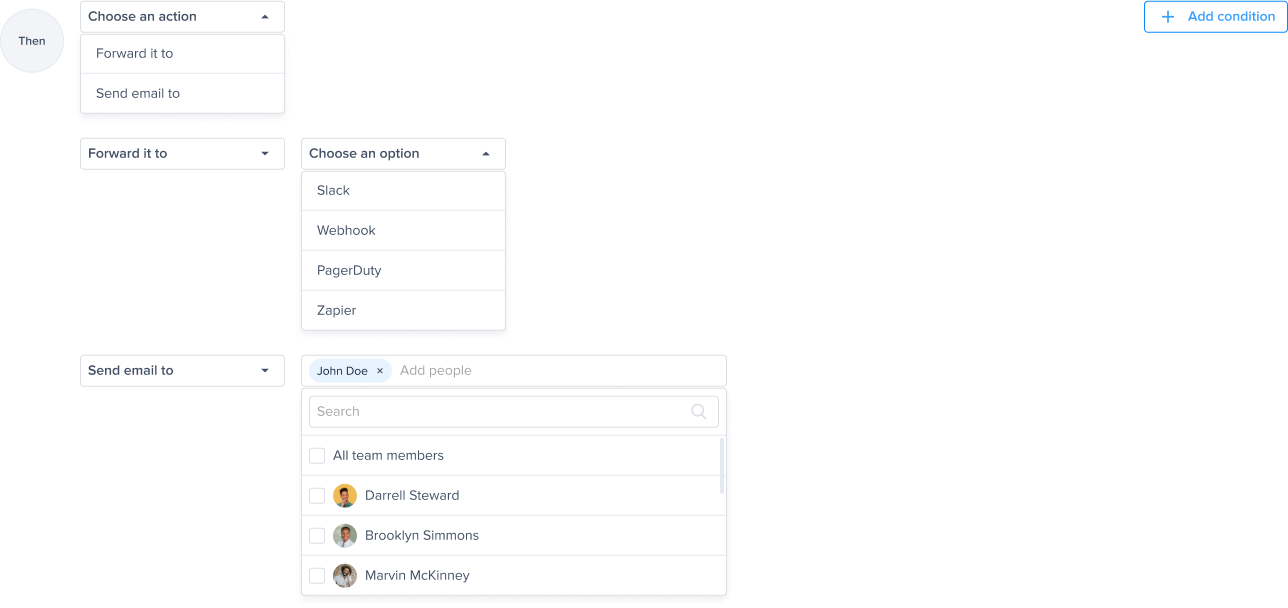
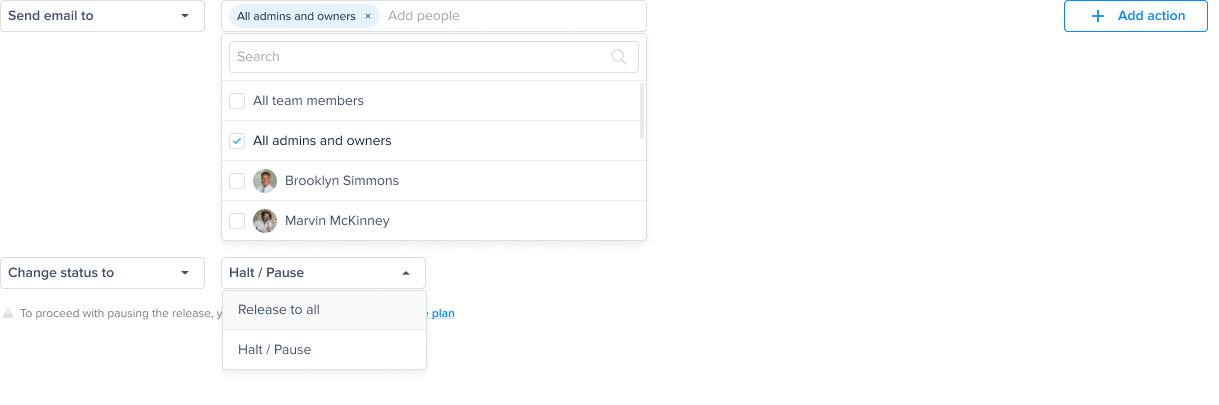
Forward your alert to slack
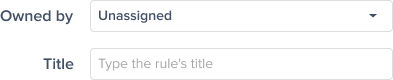
Optional - Choose the team that is responsible for this alert. And click "Save"
Triggers, conditions and Actions
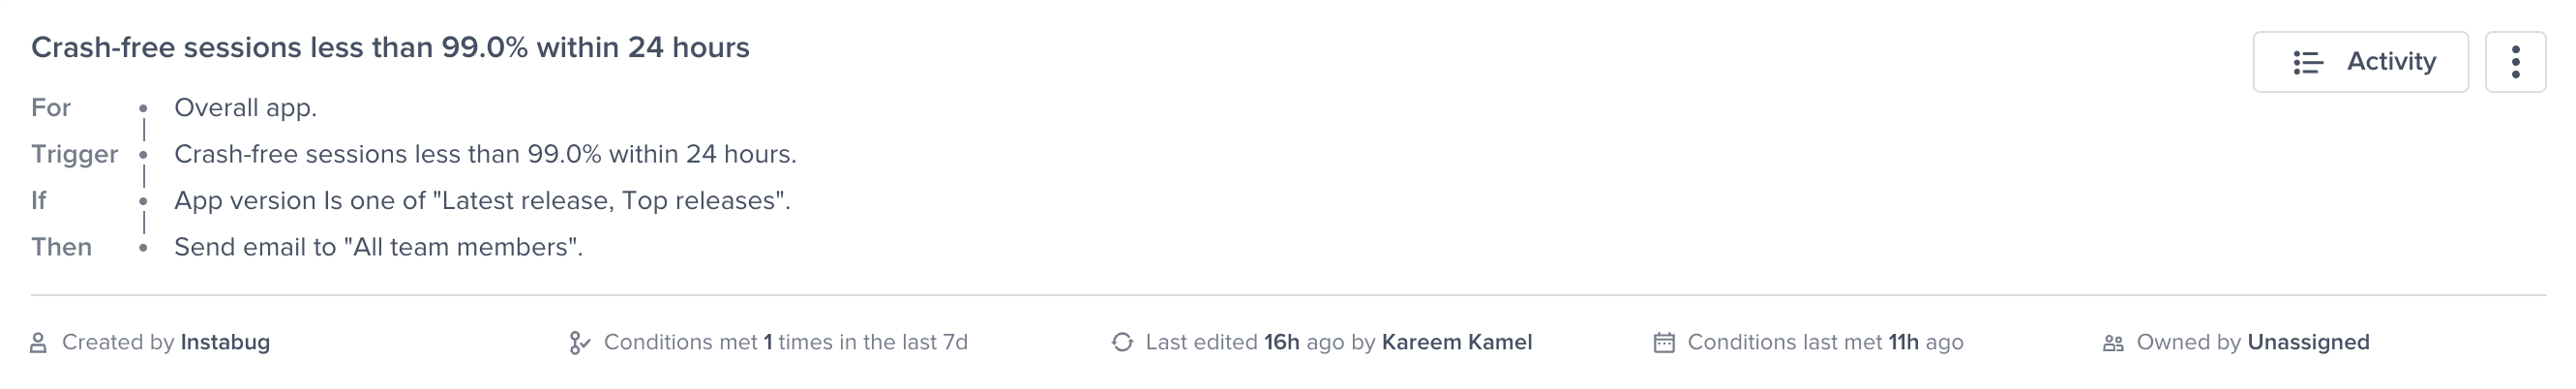
Crash-free sessions predefined alert
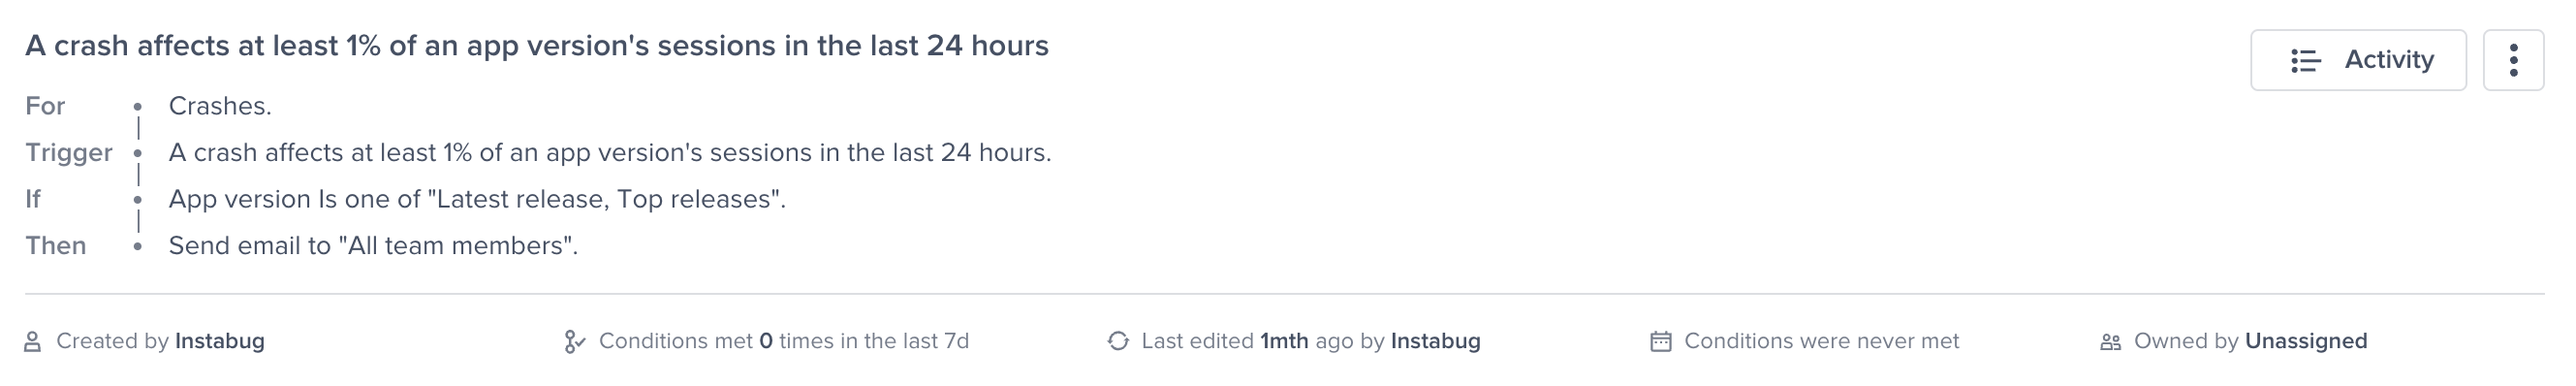
Predefined alert for a crash affecting 1% of sessions
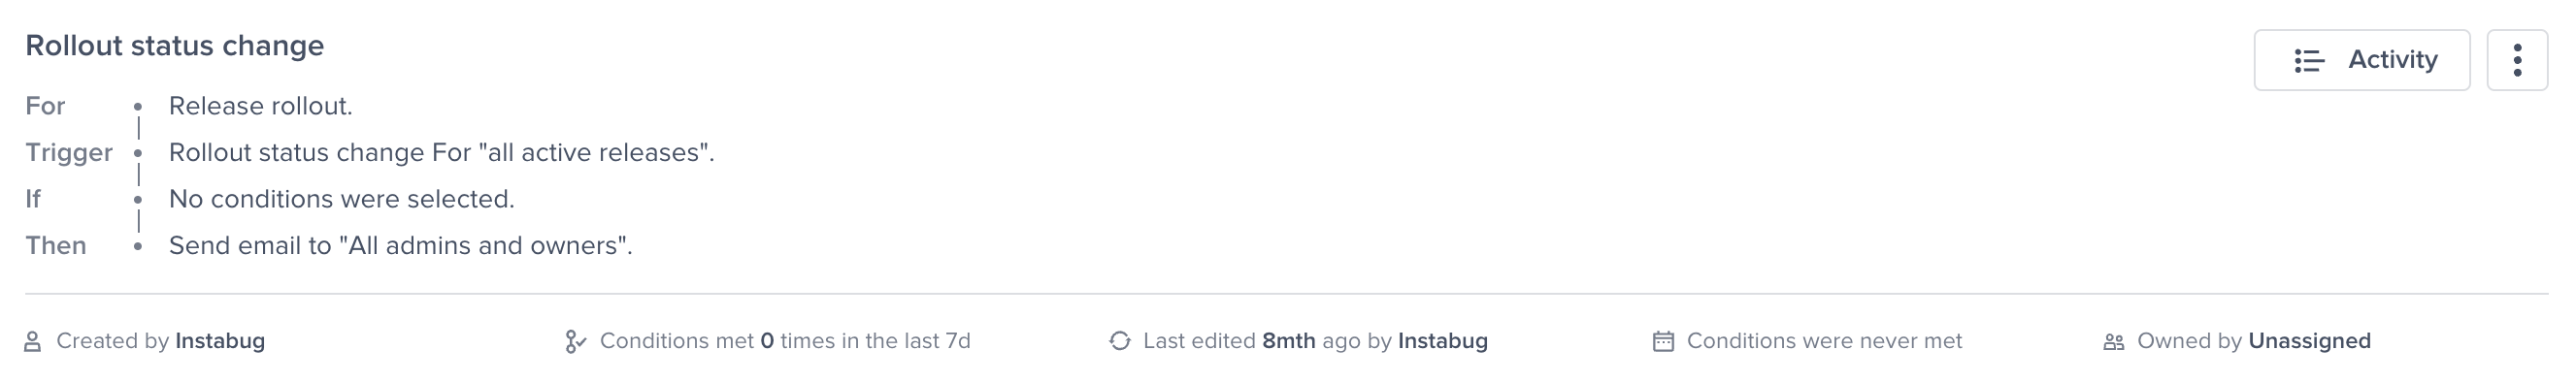
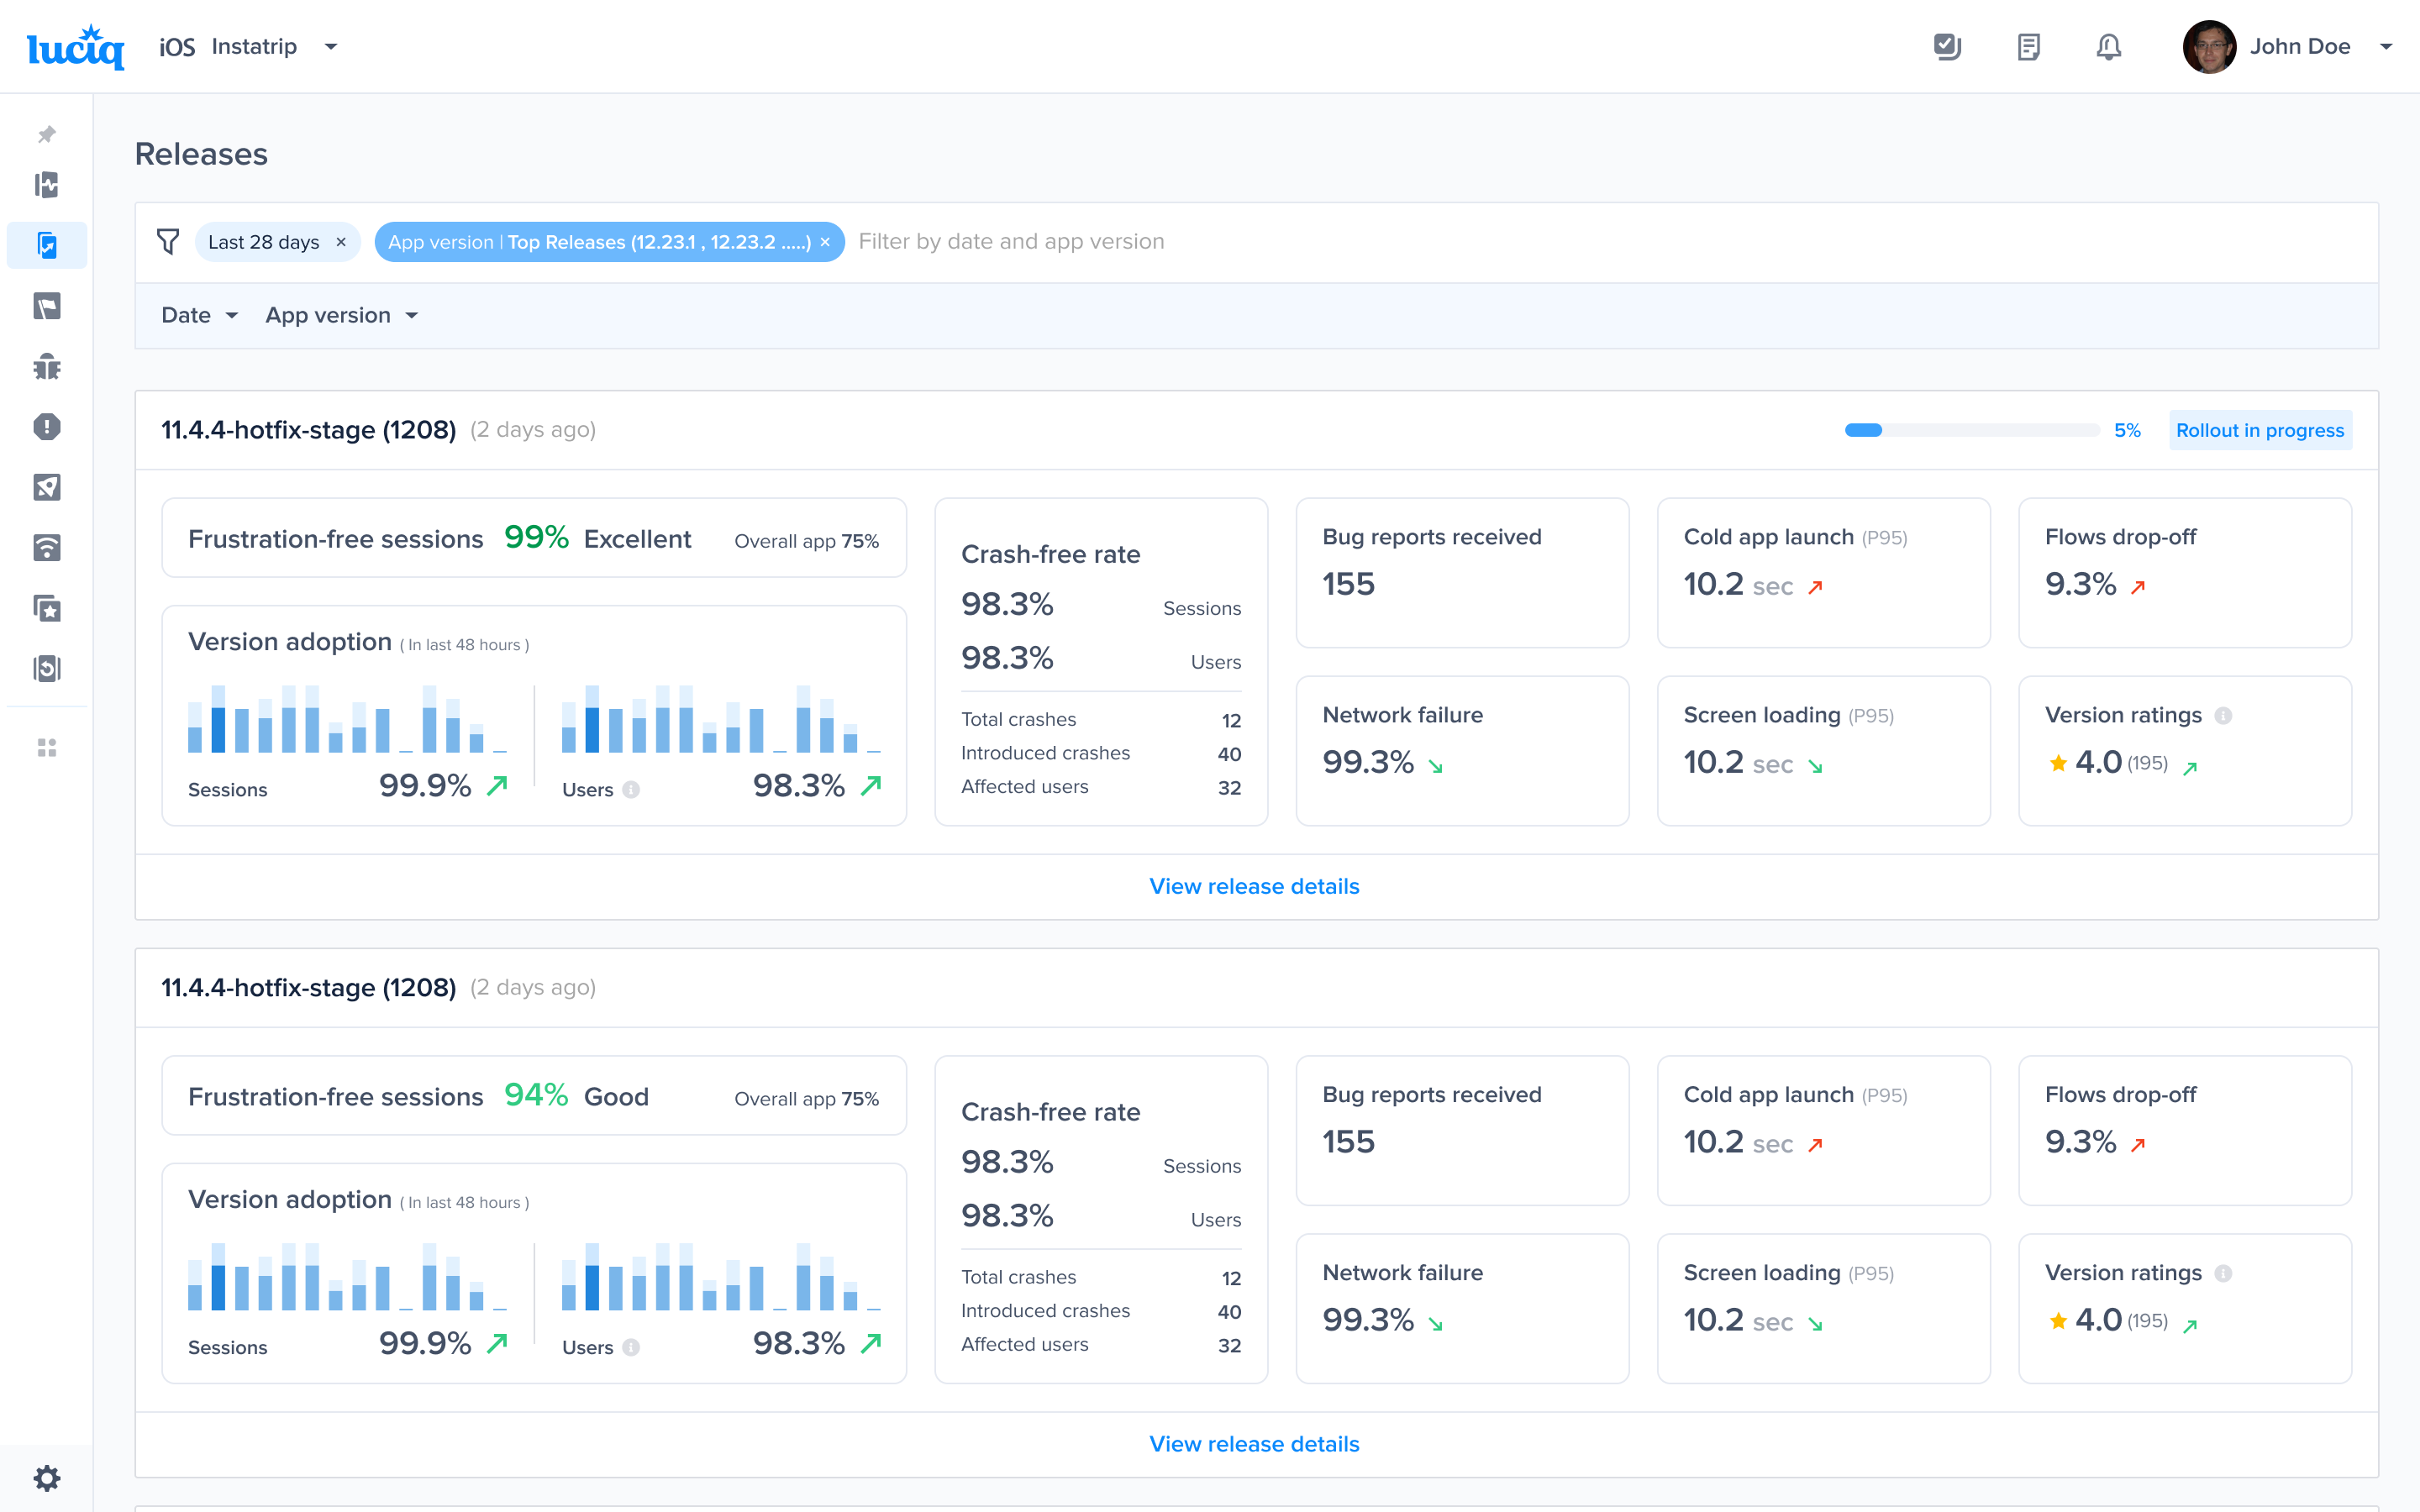
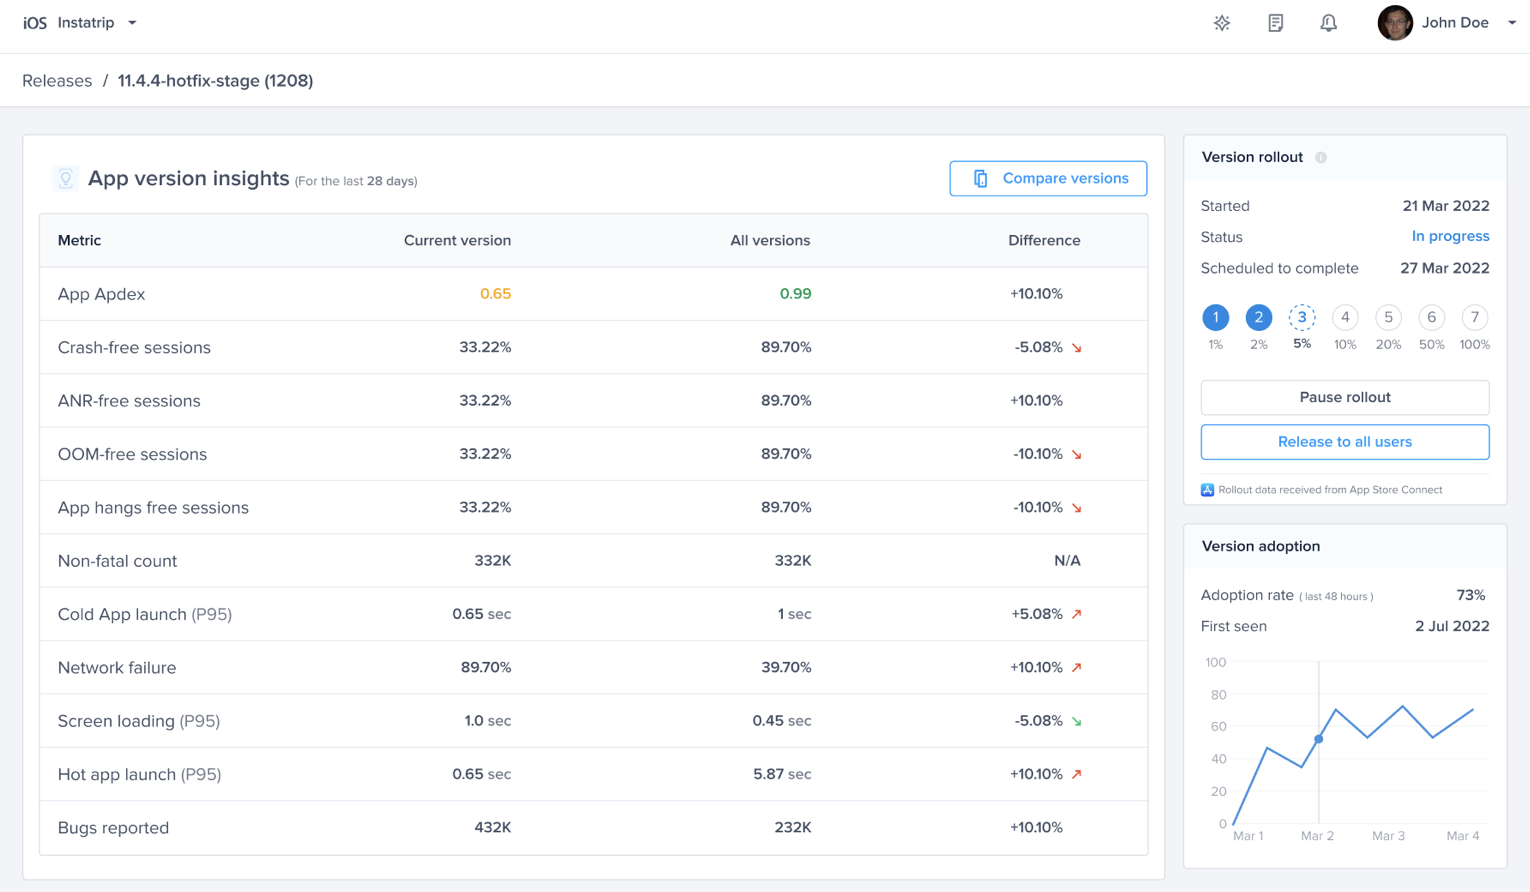
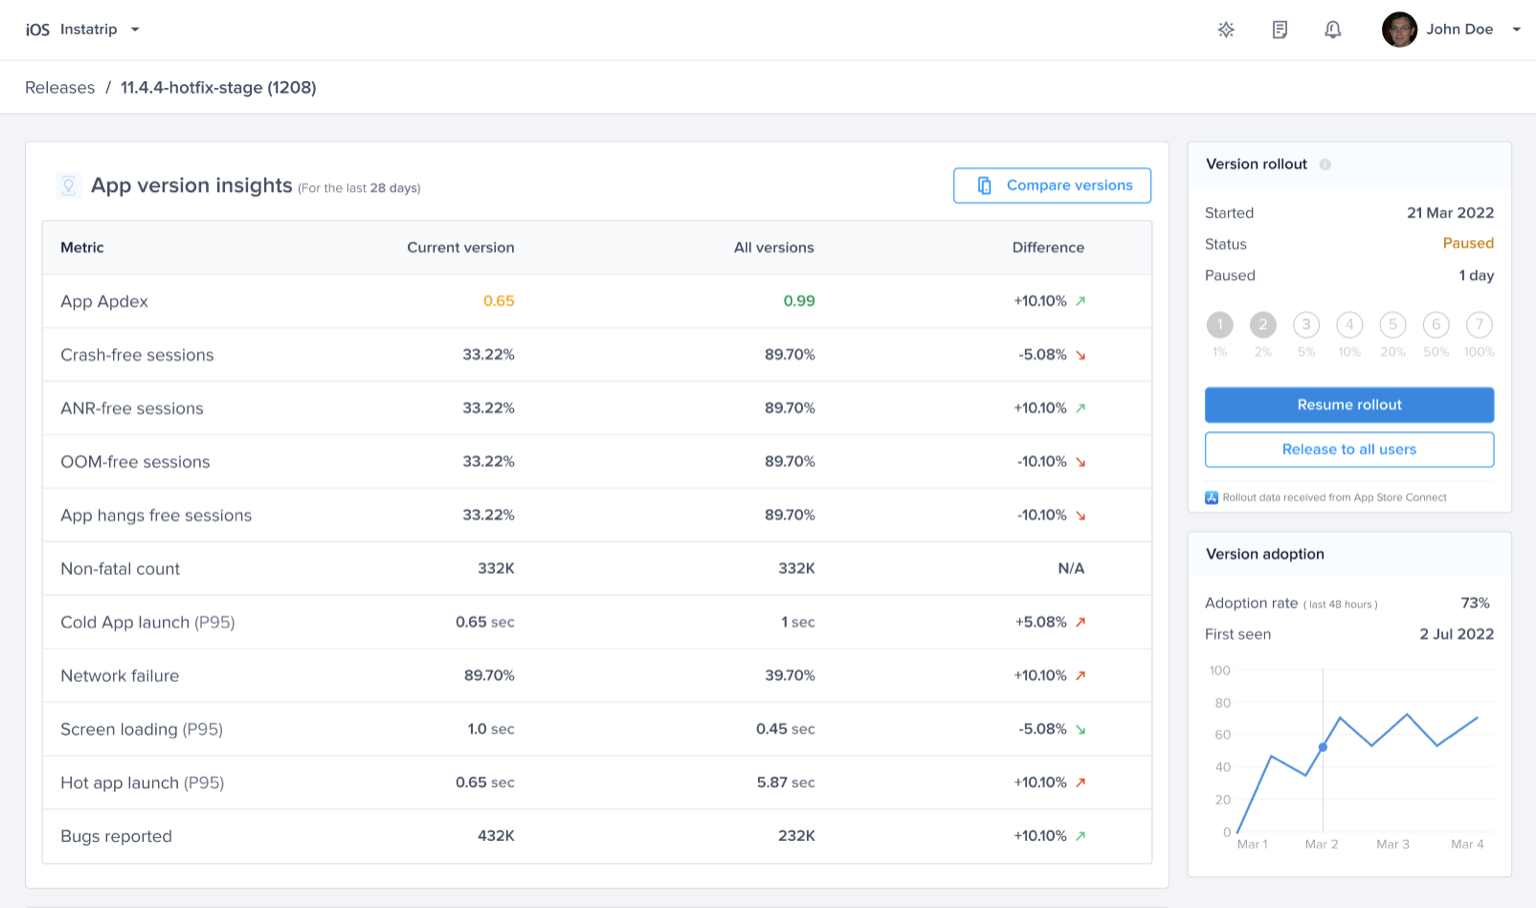
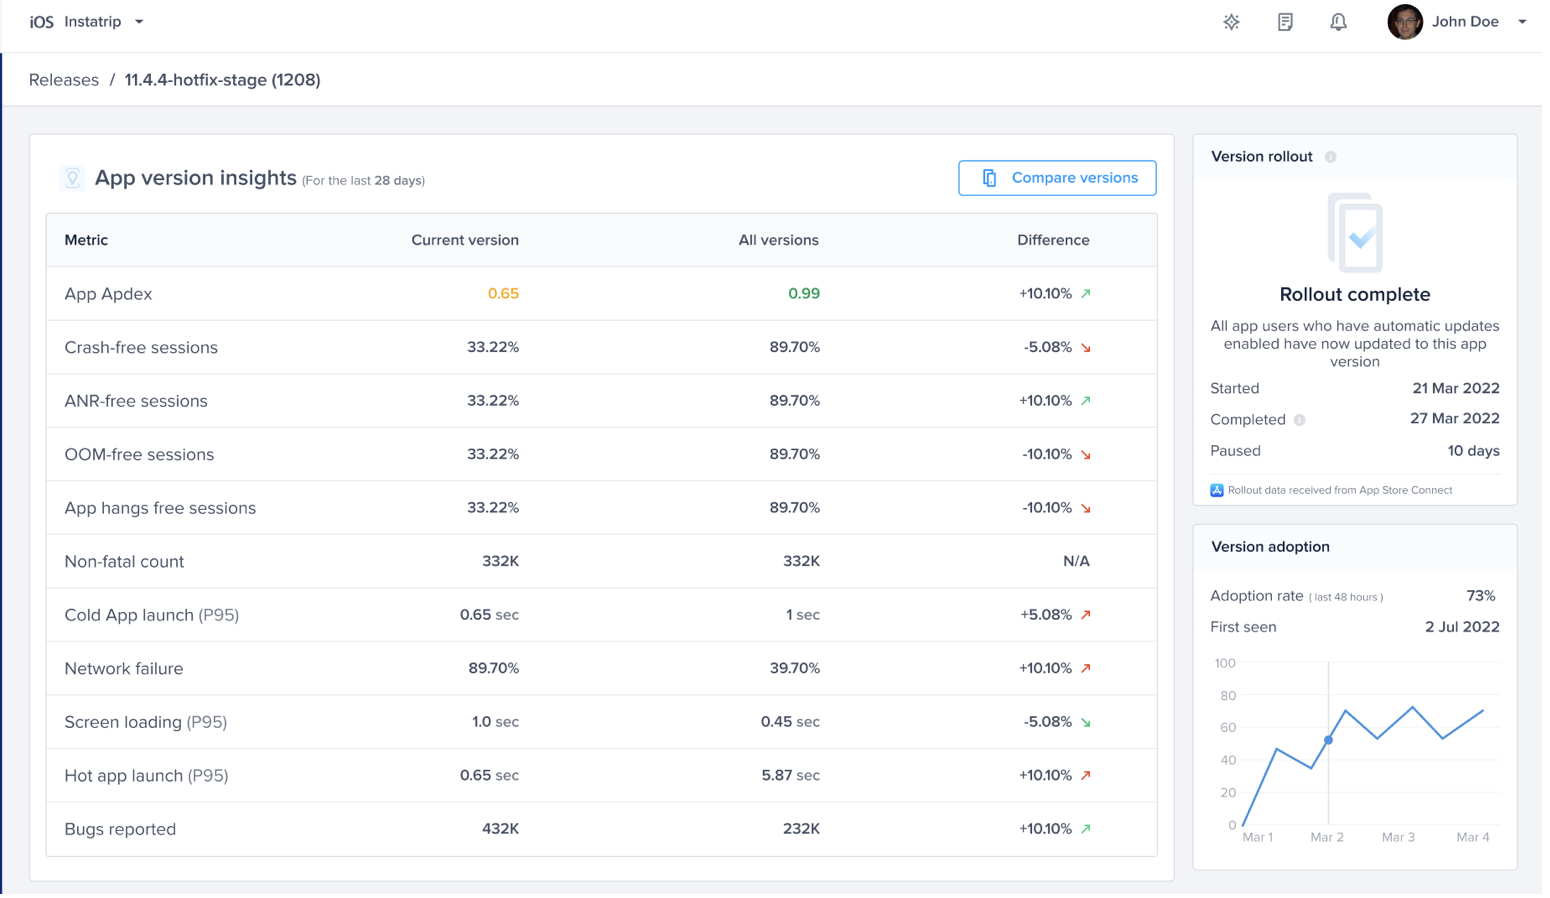
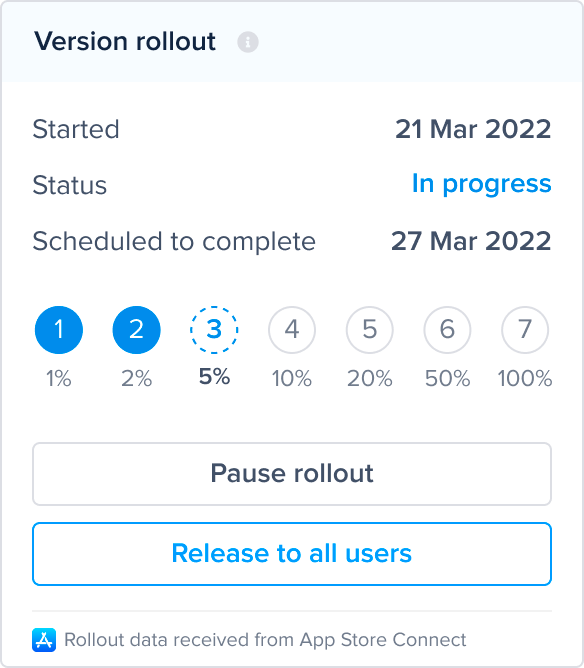
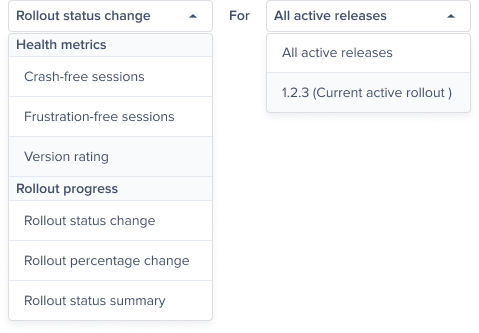
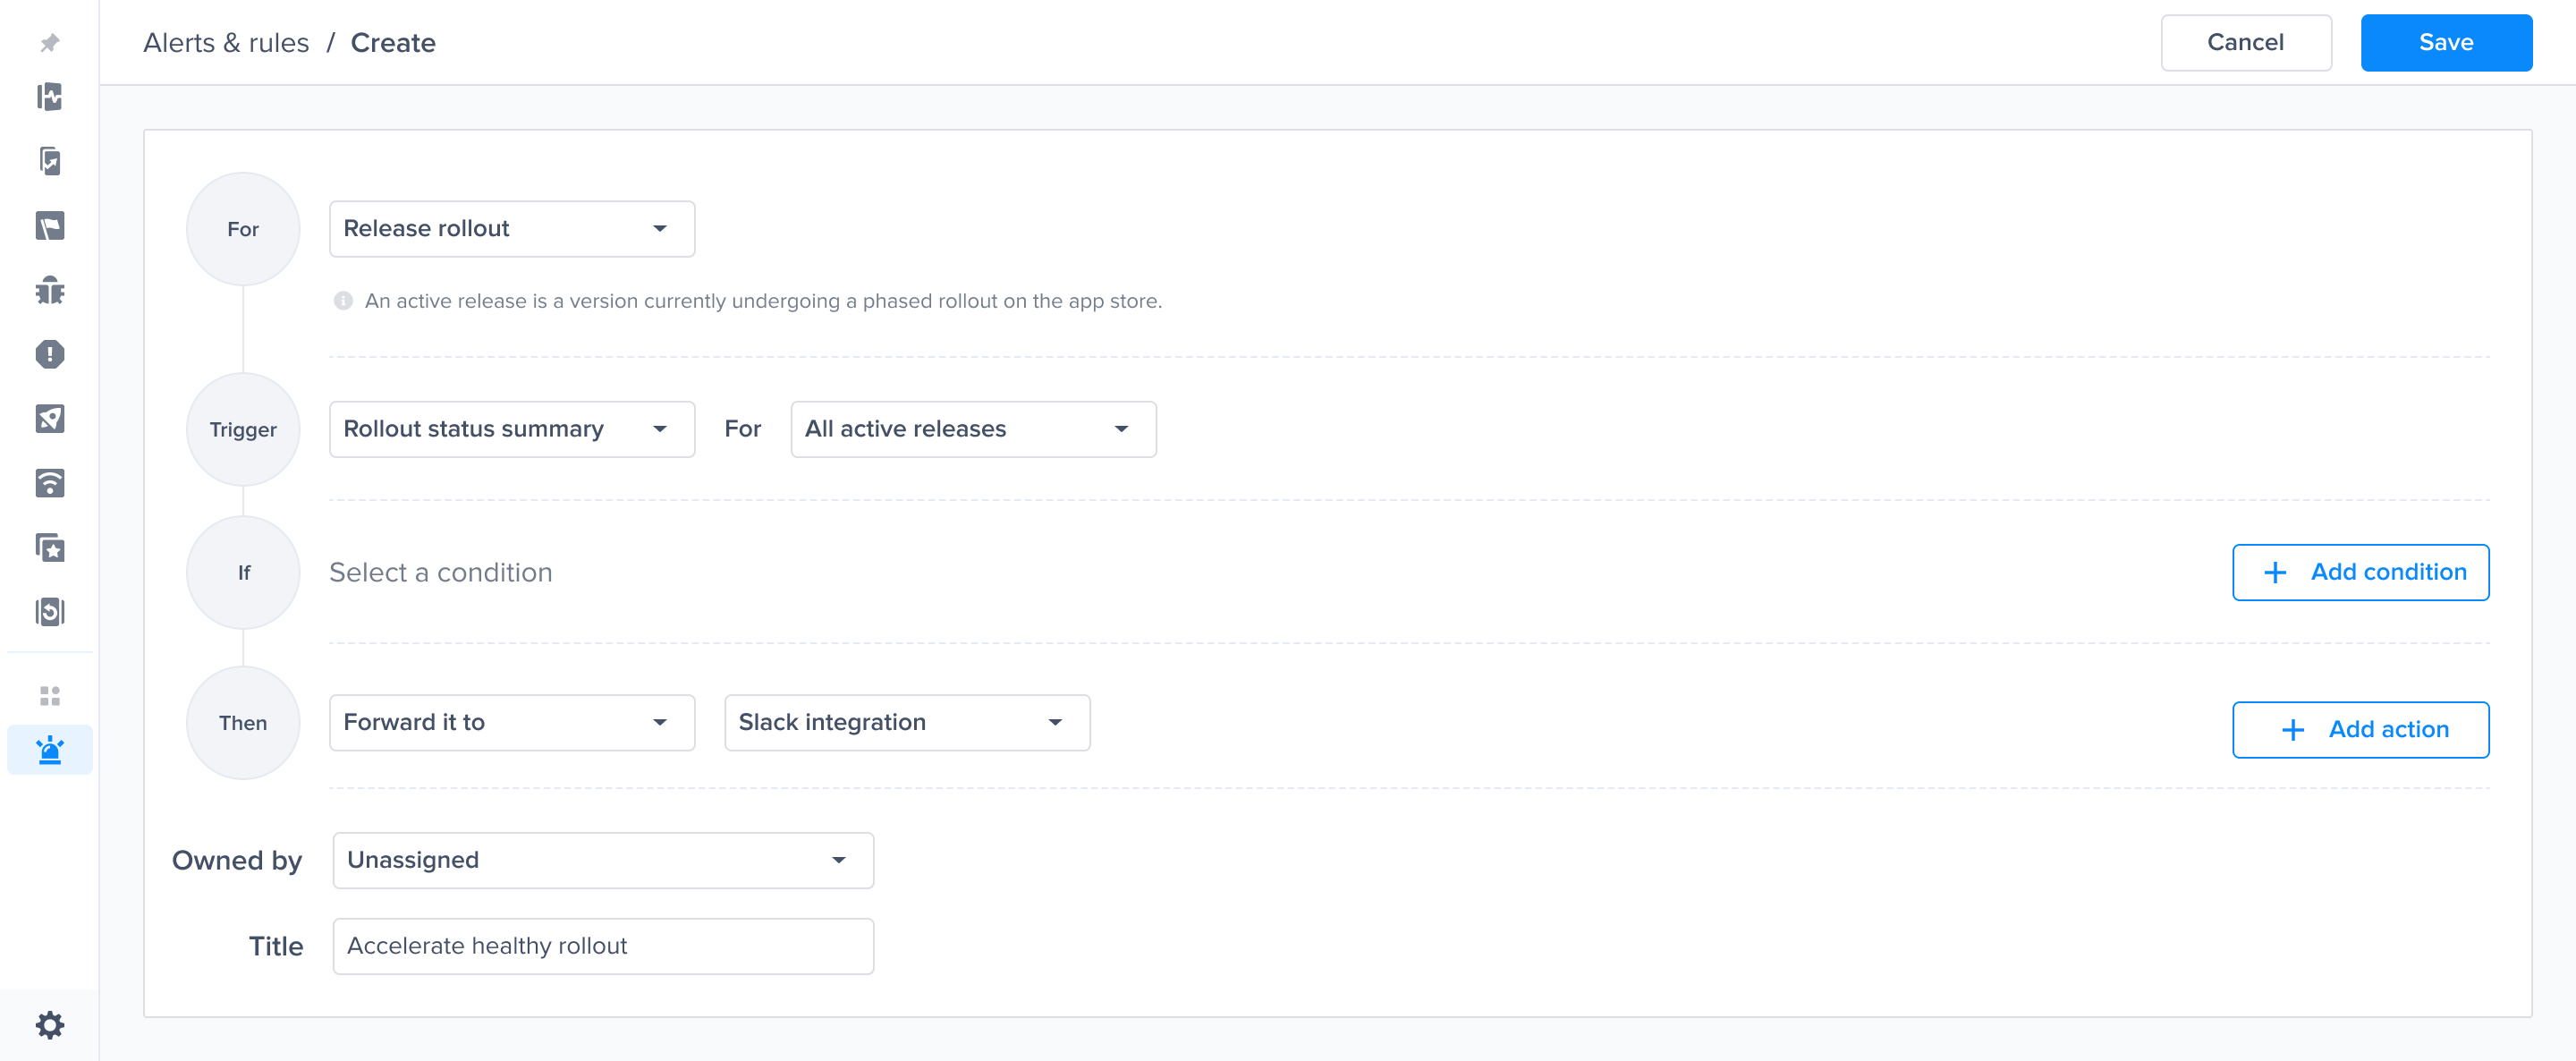
Rollout status change predefined alert


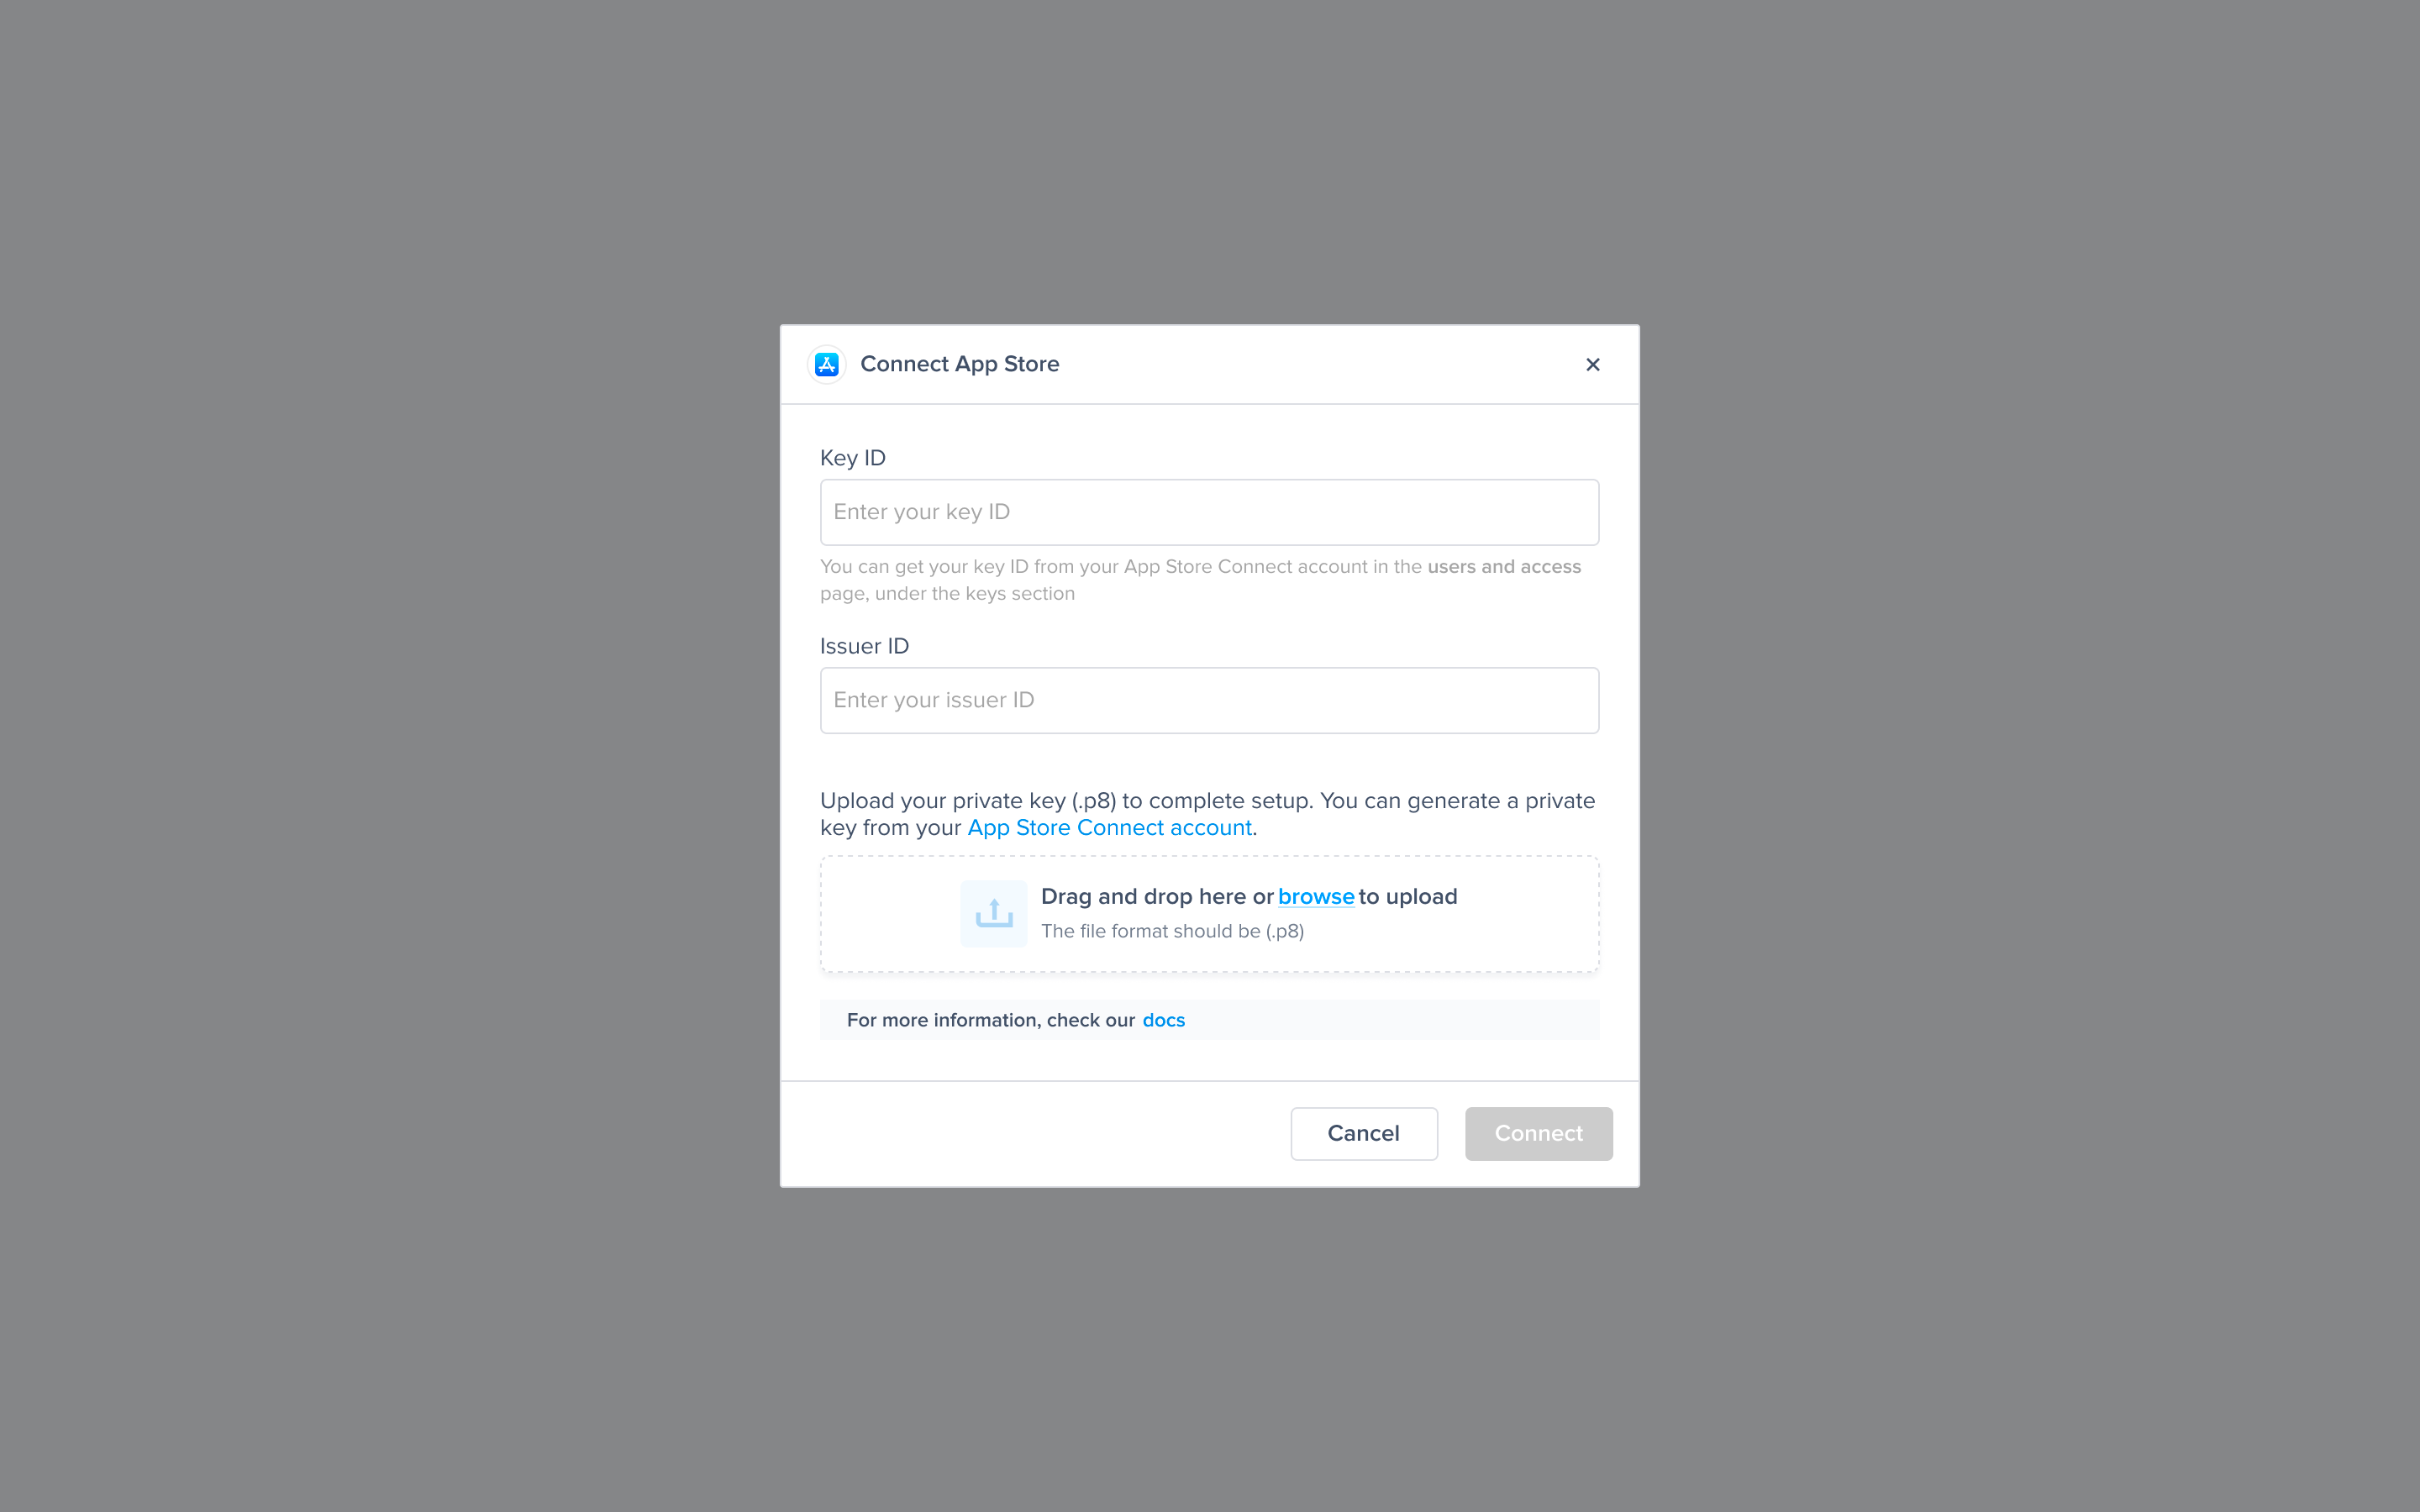


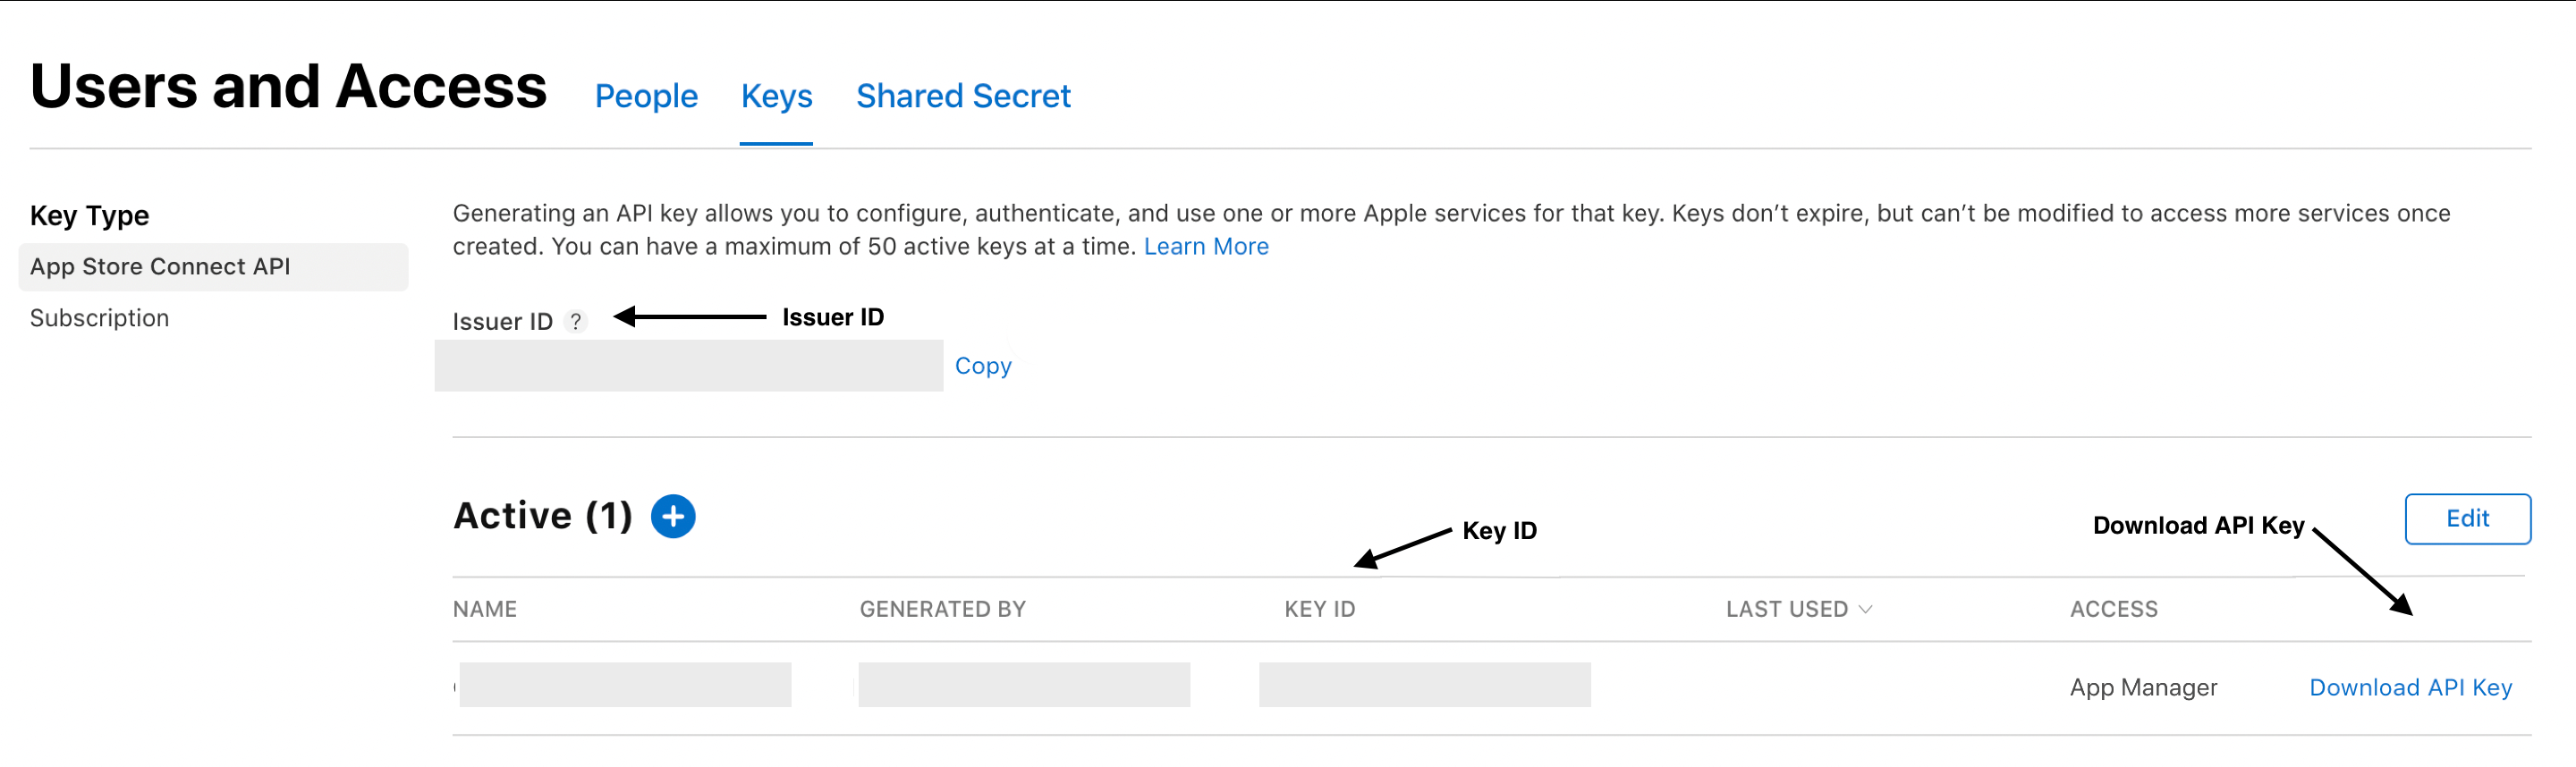
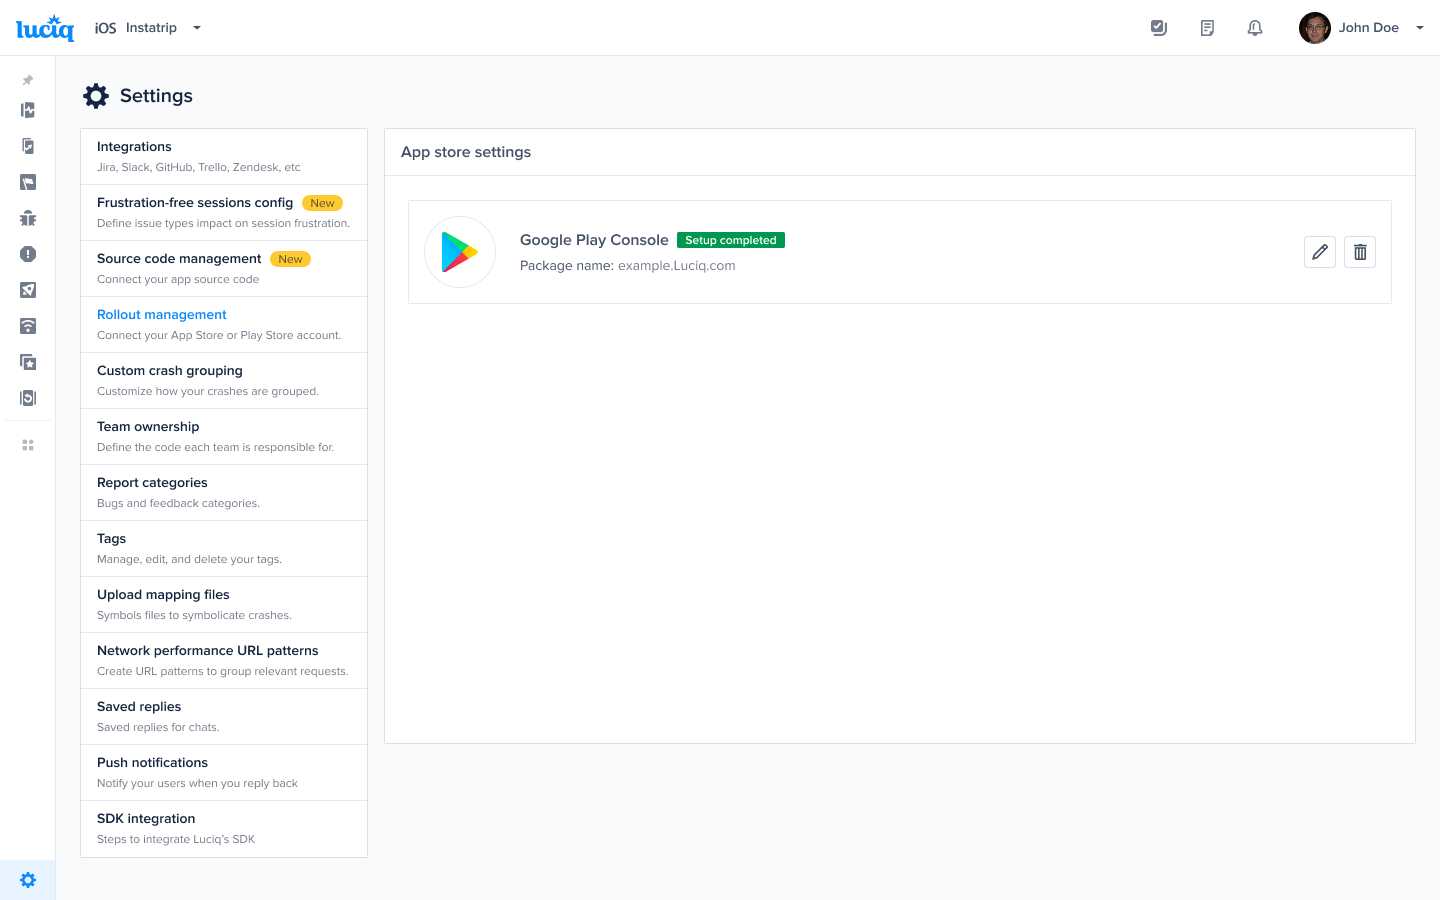
App Store Connect Dashboard