> For the complete documentation index, see [llms.txt](https://docs.luciq.ai/llms.txt). Markdown versions of documentation pages are available by appending `.md` to page URLs; this page is available as [Markdown](https://docs.luciq.ai/ios/setup-luciq-for-ios/custom-settings/logs-and-profiling/session-profiler.md).
# Session Profiler
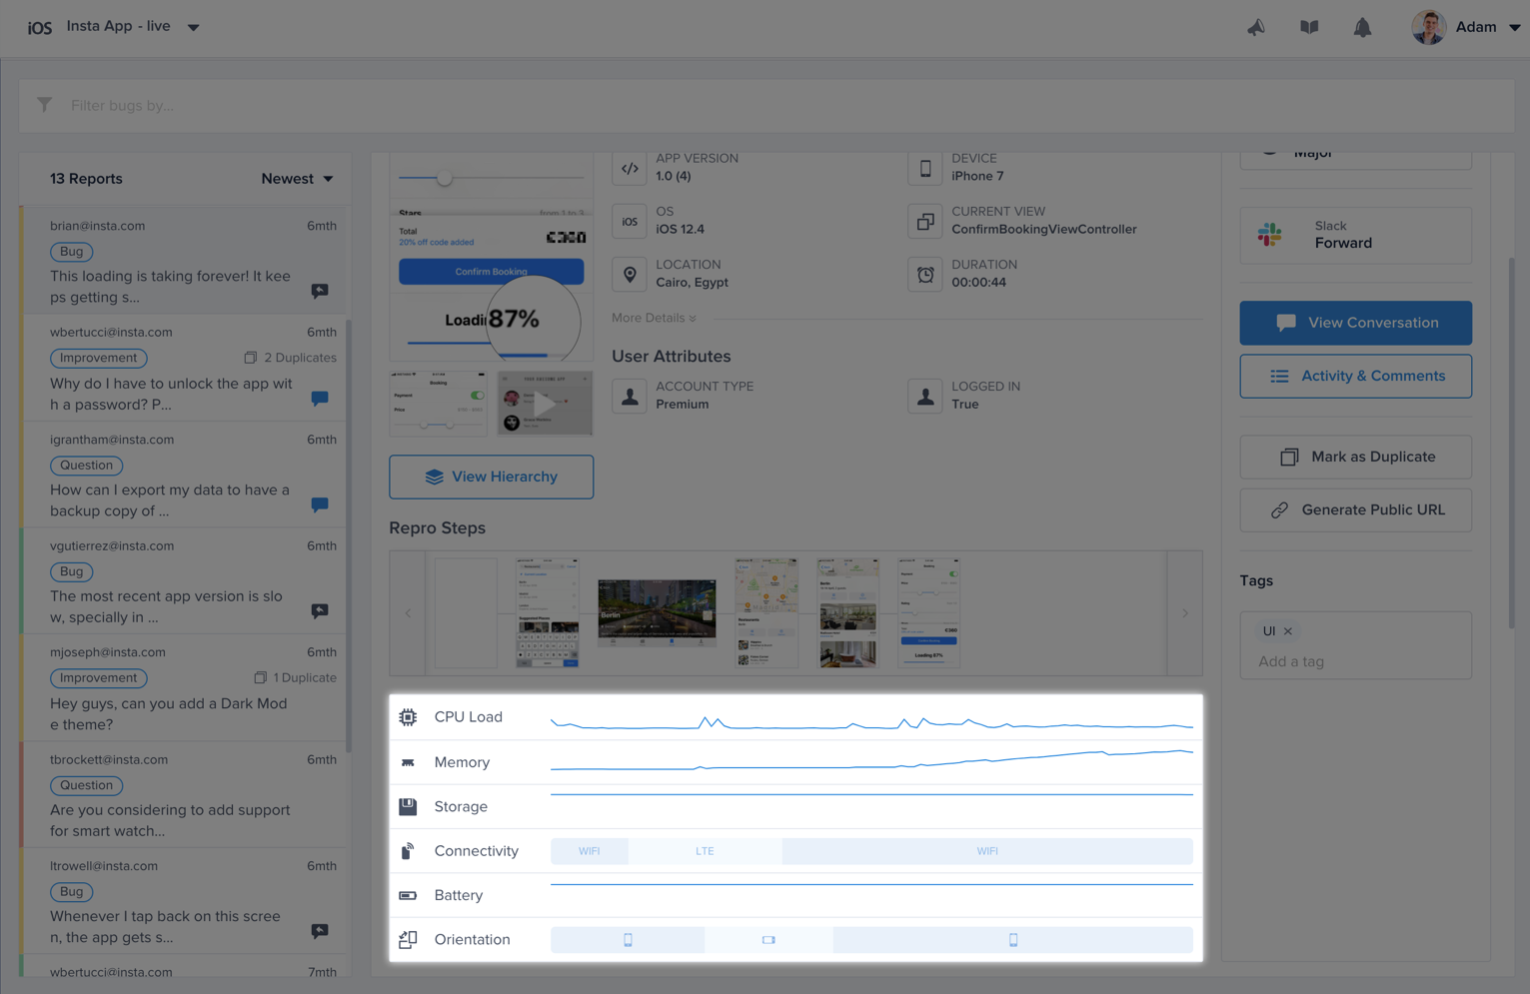
This section covers the details contained in the Session Profiler that appears with all bug and crash reports in your dashboard for iOS apps.
The Session Profiler captures the state of the device as well as your app in the 60 seconds before a report is sent. The Session Profiler is sent with both bug and crash reports.
### Data Breakdown
#### CPU
This graph shows the CPU usage of your application. While hovering over the graph, the exact CPU load of the app, in percentage, is shown. App CPU usage is captured every 0.5 seconds.
#### Memory
This graph shows the memory usage of your application. Each application runs on a single process, while hovering over a graph, we show the memory used from the process the application is running on over the total available memory for that process, as well as the exact usage percentage. Device memory usage is captured every 0.5 seconds.
#### Storage
This graph shows how much storage is used by the device. While hovering over a graph, the exact storage usage is shown over the total amount of storage available, as well as the exact usage percentage. Device storage usage is captured every 0.5 seconds.
#### Connectivity
This graph shows the connectivity details of the device. While hovering over a graph, connectivity details are shown such as WiFi name, cellular connectivity type (GPRS, Edge, 3G, LTE or CDMA), carrier name, and "No connection" if there is no network connectivity. Device connectivity details are captured every two seconds.
#### Battery
This graph shows the battery percentage of the device. While hovering over a graph, the exact percentage of the battery is shown, as well as whether or not the device is plugged in. Device battery state is captured every two seconds.
#### Orientation
This graph shows the orientation state of the application, such as whether the application is in portrait or landscape mode. While hovering over a graph, the exact state is shown. App orientation is captured every two seconds.
### Enabling and Disabling Session Profiler
Session Profiler is enabled by default, however, you can use the below method to enable or disable it manually.
{% tabs %}
{% tab title="Swift" %}
{% code overflow="wrap" %}
```swift
Luciq.sessionProfilerEnabled = true
```
{% endcode %}
{% endtab %}
{% tab title="Objective-C" %}
{% code overflow="wrap" %}
```objectivec
[Luciq setSessionProfilerEnabled:YES];
```
{% endcode %}
{% endtab %}
{% endtabs %}
---
# Agent Instructions
This documentation is published with GitBook. GitBook is the documentation platform designed so that both humans and AI agents can read, navigate, and reason over technical content effectively. Learn more at gitbook.com.
## Querying This Documentation
If you need additional information that is not directly available in this page, you can query the documentation dynamically by asking a question.
Perform an HTTP GET request on the current page URL with the `ask` query parameter, and the optional `goal` query parameter:
```
GET https://docs.luciq.ai/ios/setup-luciq-for-ios/custom-settings/logs-and-profiling/session-profiler.md?ask=&goal=
```
`ask` is the immediate question: it should be specific, self-contained, and written in natural language.
`goal` is optional and describes the broader end goal you are ultimately trying to accomplish on behalf of the user. GitBook uses it to tailor the answer towards what is most useful for that goal.
The response will contain a direct answer to the question and relevant excerpts and sources from the documentation.
Use this mechanism when the answer is not explicitly present in the current page, you need clarification or additional context, or you want to retrieve related documentation sections.